National Institute of Standards and Technology (NIST)
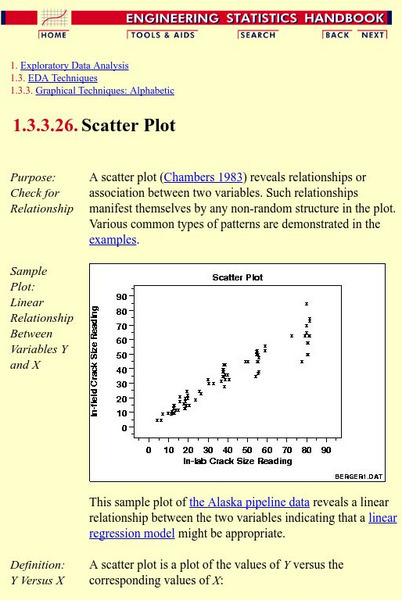
Nist: Engineering Statistics Handbook: Scatter Plots and Linear Regression
An explanation of scatter plots followed by examples of the many different kinds of scatter plots.
Khan Academy
Khan Academy: Positive and Negative Linear Associations From Scatter Plots
Practice identifying the types of correlations shown in scatter plots. Sometimes we see linear correlations (positive or negative), sometimes we see non-linear correlations (the data seems to follow a curve), and other times we don't see...
Illustrative Mathematics
Illustrative Mathematics: S Id.6 Used Subaru Foresters
Help Jane sell her Forrester! Using the data given, students will make an appropriate plot with well-labeled axes that would allow you to see if there is a relationship between price and age and between price and mileage. Students are...
BSCS Science Learning
Bscs: Budburst Lilac Festival
In this Inquiry, students predict the best date to host a lilac blossom festival so that lilacs are in full bloom in the city where students live. Students are introduced to Project Budburst, a citizen science project in which volunteers...
Texas Instruments
Texas Instruments: Boat Registration and Manatee Deaths in Florida
Students will explore the data on boat registrations and manatee deaths in Florida. They will use the data, the graph of the data and the line of best fit to make predictions about the relationship of the data.


