Curated OER
Scatter Plots
In this scatter plots worksheet, learners solve and complete 4 different problems. First, they use the table shown to model the relation with a scatter plot and trend line and to predict the value of a variable when given the other...
Curated OER
Scatter Plots
In this scatter plots worksheet, students solve and complete 6 different problems. First, they create a scatter plot to illustrate how weight and height are related and determine their relationship as positive, negative or no relation....
Curated OER
Graphing and Analyzing
In this graphing and analyzing worksheet, 9th graders first state if each graph represents a linear or nonlinear relationship. Second, they create a difference table for each set of data presented and determine whether it represents a...
Albert Shanker Institute
Economic Causes of the March on Washington
Money can't buy happiness, but it can put food on the table and pay the bills. The first of a five-lesson unit teaches pupils about the unemployment rate in 1963 and its relationship with the March on Washington. They learn how to create...
Curated OER
Statistics
In this statistics learning exercise, 9th graders solve and complete 5 different word problems that include different data. First, they determine if there is an explanatory and a response variable in the given data set. Then, students...
Springfield Public Schools District 186
The Adventures of Tom Sawyer Study Guide
Check understanding of plot with a study guide for The Adventures of Tom Sawyer by Mark Twain. Separated into sections, you might split this up into pieces or give it to individuals as a packet. The questions are mostly lower level,...
Curated OER
Scatterplots
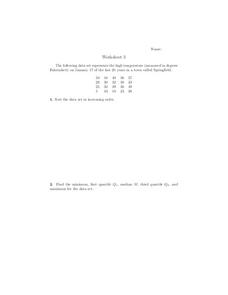
For this scatterplots worksheet, 9th graders solve and complete 6 different word problems with different sets of data. First, they sort the data set in increasing order and find the minimum, first quartile, median, third quartile, and...
Curated OER
Verdi
Third graders explore language arts by answering study questions about a book they read. In this reading summary lesson, 3rd graders read the book Verdi by Janell Cannon and identify the plot, characters and sequence of the story....
Orlando Shakes
Arms and the Man: Study Guide
Few aspects of life make better fodder for a comedic play than politics. A study guide introduces George Bernard's Shaw comedy Arms and the Man. Along with summaries of each scene and brief biographies of the main characters, two lesson...
Curated OER
What Can Scatterplots Tell Us?
Eighth graders use data from surveys conducted with parents, peers and themselves to create computer-generated scatterplots. They make inferences from their scatterplots.
Curated OER
Whose Breakfast isn't for the Birds?
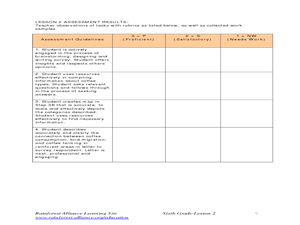
Students explore coffee production. In this cross-curriculum rainforest ecology instructional activity, students research regions where coffee comes from and investigate how the native birds in the rainforest are effected by coffee...
Curated OER
Investigating the Soil
Students explore the Earth's crust by researching pH levels and acidity. In this environmental safety lesson, students identify the pros and cons of acidity within soil and how it affects plants. Students collaborate in a pH level...
Other popular searches
- Math Scatter Plots
- Algebra Scatter Plots
- Creating Scatter Plots
- Candy Scatter Plots
- Data for Scatter Plots
- Pre Algebra/ Scatter Plots
- Interpreting Scatter Plots
- Prue Algebra/ Scatter Plots
- Halloween Scatter Plots
- Scatter Plots and Correlation
- Pr Algebra/ Scatter Plots
- Scatter Plots Ti 83


