Oswego City School District
Regents Exam Prep Center: Scatter Plots and Line of Best Fit
Use this lesson, practice exercise, and teacher resource in planning instruction on scatter plots and line of best fit. In the lessons, you'll find definitions and examples of ways to make a scatter plot, determine correlations, and find...
University of Regina (Canada)
University of Regina: Math Central: Scatter Plots
Three different concepts are examined about scatter plots. Topics featured are collecting data, analyzing scatter plots, and determining a line of "best fit". The lesson plan has an overview, material, procedures, and evaluation techniques.
CK-12 Foundation
Ck 12: Statistics: Scatter Plots and Linear Correlation
[Free Registration/Login may be required to access all resource tools.] In this tutorial, students learn how to interpret data through the use of a scatter plot.
Other
Sky Mark: Scatter Plots
This page gives a description of scatter plots along with examples. Also provides explanations and statistics to aid student understanding.
University of Regina (Canada)
University of Regina: Math Central: Scatter Plots
Three different concepts are examined about scatter plots. Topics featured are collecting data, analyzing scatter plots, and determining a line of "best fit". The lesson has an overview, material, procedures, and evaluation techniques.
Alabama Learning Exchange
Alex: My Peanut Butter Is Better Than Yours!
This lesson plan provides a real-world example of using a scatter plot to compare data. It gives an assessment and ideas for remediation, extension as well as ways to manage behavior problems and reluctant learners.
Illustrative Mathematics
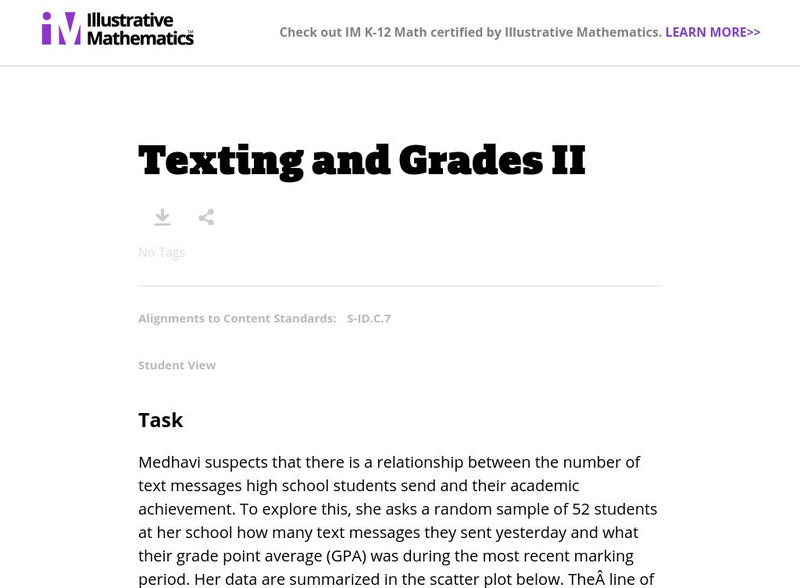
Illustrative Mathematics: S Id.7 Texting and Grades
Medhavi suspects that there is a relationship between the number of text messages high school students send and their academic achievement. To explore this, she asks a random sample of 52 students at her school how many text messages...
Illustrative Mathematics
Illustrative Mathematics: 8.sp Us Airports, Assessment Variation
The scatter plot below shows the relationship between the number of airports in a state and the population of that state according to the 2010 Census. Each dot represents a single state. Students will explore the relationship between the...
Illustrative Mathematics
Illustrative Mathematics: 8.sp Laptop Battery Charge
This task looks at how long it takes for a laptop battery to fully charge. Students make a scatter plot of data, draw a 'line of best fit,' and predict the time it will take to reach a full charge. Aligns with 8.SP.A.2.
Alabama Learning Exchange
Alex: My Peanut Butter Is Better Than Yours!
The students will engage in the process of statistical data comparing data using tables and scatterplots. The students will compare data using measures of center (mean and median) and measures of spread (range). This lesson can be done...
PBS
Pbs Teachers: In a Heartbeat [Pdf]
Apply knowledge of scatter plots to discover the correlation between heartbeats per minute before and after aerobic exercise.
Missouri State University
Missouri State University: Introductory Statistics: Linear Regression Models
Four examples which use the linear regression model in real-world applications. The site continues with discussion on how to correctly construct the regression model, how its results can be analyzed, and what can come from it.
Texas Education Agency
Texas Gateway: Interpreting Scatterplots
Given scatterplots that represent problem situations, the student will determine if the data has strong vs weak correlation as well as positive, negative, or no correlation.
OER Commons
Oer Commons: Measuring Circles
Seventh graders will measure the circumference and diameter of round things in the classroom and discover the ratio pi. They will see that the ratio of a circle's circumference to its diameter can be used to solve for the circumference...
Alabama Learning Exchange
Alex: Statistically Thinking
The object of this project is for learners to learn how to find univariate and bivariate statistics for sets of data. Also, the students will be able to determine if two sets of data are linearly correlated and to what degree. The...
Other
Introduction to Simple Linear Regression
This introduction to simple linear regression includes graphs and a discussion of extrapolation and interpolation.
Other popular searches
- Math Scatter Plots
- Algebra Scatter Plots
- Creating Scatter Plots
- Candy Scatter Plots
- Data for Scatter Plots
- Pre Algebra/ Scatter Plots
- Interpreting Scatter Plots
- Prue Algebra/ Scatter Plots
- Halloween Scatter Plots
- Scatter Plots and Correlation
- Pr Algebra/ Scatter Plots
- Scatter Plots Ti 83


