Hi, what do you want to do?
Khan Academy
Fitting a Line to Data, Regression, Probability and Statistics
Sal trades his tablet for an Excel spreadsheet in this video, which covers fitting data to a line. Using a word problem about median income, he not only solves the problem but also demonstrates how to use scatter plots and Excel tools in...
Bozeman Science
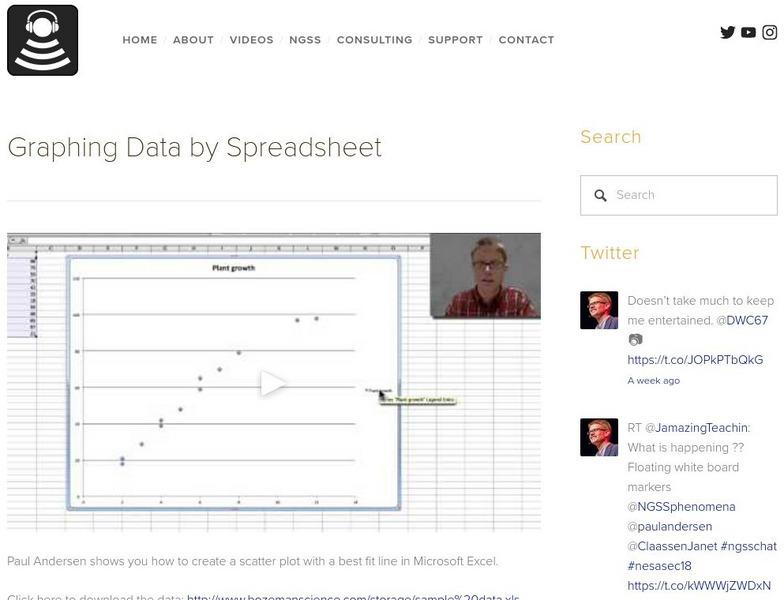
Graphing Data by Spreadsheet
Watch your pupils Excel at using spreadsheets to graph data by watching a video that covers how to graph data in a scatter plot using Microsoft Excel. The video also covers how to change titles, scales, and labels, as well as how to...
Curated OER
Calculate the Slope of a Line Using Two Points
Find that slope! This video does an excellent job of demonstrating how to use the slope formula to find the slope of a line using two points. The instructor first reviews the definition of slope of a line, then works three problems using...
Bozeman Science
Bozeman Science: Graphing Data by Spreadsheet
Paul Andersen shows you how to create a scatter plot with a best fit line in Microsoft Excel. You can go here to download the data: http://www.bozemanscience.com/storage/sample%20data.xls


