EngageNY
Evaluating Reports Based on Data from a Sample
Statistics can be manipulated to say what you want them to say. Teach your classes to be wise consumers and sort through the bias in those reports. Young statisticians study different statistical reports and analyze them for...
Curated OER
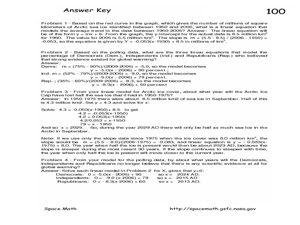
The Global Warming Debate and the Arctic Ice Cap
In this global warming and the Arctic ice cap worksheet, students use two graphs showing data about the amount of Arctic sea ice between 1950 and 2006 and the percent of people surveyed that believe the Earth has gotten warmer over the...
Curated OER
Magnetic Polls
Students explore the New Hampshire primaries and the polling process by analyzing polling information, examining the effects of polls, and creating graphs that represent polling data.
Curated OER
Campaign 2000
Students research newspapers and the Internet to learn about the election. Students work in groups and choose a state that they want to compare to Florida. Students organize the data they have found into a graph labeling an "x" and "y"...
Curated OER
You Know the Answer
In this problem solving worksheet, 4th graders are given an answer to a question and must solve the mathematical problems to discover the secret question. Students solve for 18 problems using addition, subtraction, multiplication and...
Other popular searches
- Democrat Republican
- Democrat or Republican
- Democrat or Republican Quiz
- Democratic Republican Party
- Democrat and Republican
- Republican vs Democrat Quiz
- Democratic Republican Parties
- Democrat or Republican?
- Republican Democrat Us
- Democrats and Republican


