Curated OER
Attributes of Accuracy
Middle schoolers explain necessity in using accurate instruments when measuring, and how measurements can be checked for accuracy. They make a six-inch ruler, design, test, and evaluate a system to measure work, and produce a table and...
Curated OER
Family Activity: Bar Graphs and Line Graphs
In this math learning exercise, students work at home with a family member on a graphing activity. Students count the number of cans, glass jars, boxes and bags in the pantry. Students make a bar and a line graph to represent the data.
Curated OER
More Students Taking Online Courses
In this graph worksheet, students study a bar graph that shows the number of college students taking at least one online course. Students answer 4 problem solving questions about the data on the graph.
Worksheet Web
Using Pictographs
If one ice cream cone represents three ice cream scoops, and Bob has four ice cream cones, then how many scoops does Bob have? Learners solve these kind of questions with their new understanding of pictographs.
LABScI
Genetic Equilibrium: Human Diversity
Investigate the Hardy-Weinberg Principle to explain genetic equilibrium. The 10th lesson plan of a series of 12 is a laboratory exploration of genetic equilibrium. Your classes use a mixture of beans to model allele and genotype...
Curated OER
Where In the World Are We?
Fifth graders read postcards and find their locations on maps. They use the pictures and text on the postcards to write about imaginary vacations. They compute the mileage and compare it to TripMaker data.
Curated OER
Opinion Surveys
Students examine the factors that affect the accuracy of opinion surveys. They calculate probability and chance using data they have collected. They practice reading tables and graphs as well.
Curated OER
Advanced Information Systems Database Access
Students investigate the usage of databases. They design and create their own databases to hold information. They edit the file and sort/ index the new database. They also generate a detailed report of the data present.
Curated OER
Virtual Field Trip: Lodging and Meals
Young scholars calculate the costs for lodging and meals for a virtual field trip. They calculate the number of nights lodging needed for road and city travel and the number of meals needed, the costs for each, and input the data using...
Curated OER
Sampling and Comparing Biodiversity
Students compares the density and distribution differences of four species of spiders in two hypothetical habitats. They "sample" two habitats and then do calculations such as average density and relative distributions to compare the...
Curated OER
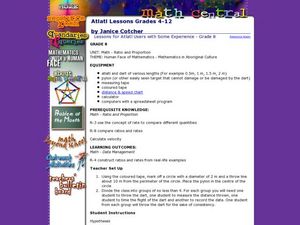
Atlatl Lessons for Grade 8
Eighth graders explore the weapons of the Aboriginal people. In this eight grade math/science instructional activity, 8th graders collect and analyze data regarding the speed and distance of a dart thrown with an atlatl. ...
Curated OER
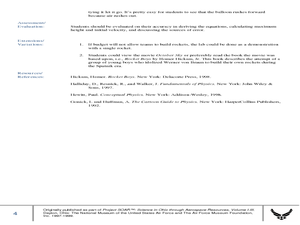
Rockets: Kinematics or Energy?
Students construct model rockets, measure and record the height of the launch. In this creative lesson students use different methods to calculate velocity and height data from their launched rockets.
Curated OER
Modelling Periodic Phenomena
In this Pre-calculus/Trigonometry instructional activity, students determine the trigonometric function that best models the given data. The eight page instructional activity contains explanation, examples, and twenty-one problems....
Curated OER
Exact or Estimation
Students solve problems using estimation and exact calculations. In this algebra lesson, students use gum balls and thread to create hands on manipulatives to solve problems. They calculate the average of their total data.
Curated OER
Hlf-Ball
Students investigate Newton's Laws of Motion and the Law of Conservation of Energy. They examine how a ball and half-ball behave and relate these laws to what happens to the ball. Students produce a graph of the data collected and...
Curated OER
Pie Graph
Fifth graders examine fractional parts of pie graphs. Given a bag of M&Ms, 5th graders interpret the data. They use a paper plate and colors to create a graph of the types of M&Ms represented.


