Curated OER
Roll `Em!
First graders engage in using base ten blocks and dice for a fun engaging math lesson. They use a worksheet imbedded in this lesson as the game board to help them play this math game.
Curated OER
Bar and Histograms (What Would You Use: Part 1)
Students practice creating bar graphs using a given set of data. Using the same data, they create a group frequency chart and histograms. They must decide the best graph for the given set of data. They share their graphs with the...
Curated OER
Histograms and Bar Graphs
Students are introduced to histograms, bar graphs, and the concept of class interval. They use an activity and three discussions with supplemental exercises to help students explore how data can be graphically represented (and...
Curated OER
Using Computers to Produce Spreadsheets and Bar Graphs
Learners review graphing terminology and how to plot data points, how to input data into a spreadsheet, and how to make a chart using a computer.
Curated OER
Cold Enough?
Students read and record temperatures and display the data. They represent the temperatures on an appropriate graph and explain completely what was done and why it was done. Students display the data showing differences in the daily...
Curated OER
T-Shirt Glyph
Learners create a glyph (a symbol or icon) that represents who they are, and read the glyphs of others to explain the glyphs' data.
Curated OER
1st Grade - Act. 03: T-Shirt Glyph
First graders create glyphs (symbols or icons) which represents them, and read the glyphs of others using a legend to explain the data on the glyphs.
Curated OER
Watts Up Doc?
Students examine the wattage of a light bulb using math. In this algebra instructional activity, students find the inverse square of given parameter. They work in groups collecting and analyzing data.
Curated OER
How does Your Province Stack Up?
Students investigate data about age, and sex of a population. In this statistics lesson, students are given data on a population to analyze and compare to other provinces. This assignment is part of a geography lesson and requires 3...
Curated OER
Jack-O-Lantern Glyph
Students create a jack-o-lantern glyph that accurately represents his or her answers to a series of questions. The completed jack-o-lanterns are displayed in the classroom and the class interprets the data.
Curated OER
Identifying Creatures
Students use a classification key from a provided worksheet to identify creatures. This task assesses student's abilities to interpret data, make decisions, identify, and classify.
Curated OER
Sex & Reproduction
Students examine animal reproduction by interpreting data and making arguments and then create their own graphs to explore relationships of organ systems. This lesson includes an individual worksheet and a reflective review question for...
Curated OER
Building Storm Shelters
Sixth graders explore area and perimeter. In this online interactive area and perimeter lesson, 6th graders investigate why the perimeter of rectangles can vary considerably even when the area is held constant. Students construct...
Curated OER
Acid and Base Testing 2
Young scholars design and conduct an experiment on unknown solutions after studying descriptions of indicators and the way in which they identify acids and bases. Students must gather, organize, and analyze data as well as make...
Curated OER
Who's Got Your Power
Students examine and map local sources of energy. They conduct Internet research on their local utility company, identify where their utility company obtains energy, graph the data, and label a map of power plant locations in their state.
Curated OER
What Is Technology, and How Does It Benefit Us?
Students examine and define what technology is as well as the differences between science and technology. They assess the role of science and technology in society, conveniences technology offers and create a chart to compare the...
Virginia Department of Education
Road Trip
Help plan a road trip with linear equations. Scholars consider two different rental car companies and write equations representing the cost for each company. They graph the system of equations to determine the conditions under which each...
Noyce Foundation
Ducklings
The class gets their mean and median all in a row with an assessment task that uses a population of ducklings to work with data displays and measures of central tendency. Pupils create a frequency chart and calculate the mean and median....
EngageNY
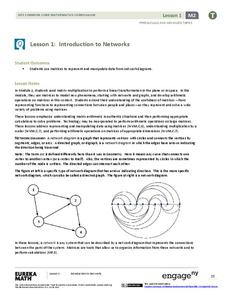
Introduction to Networks
Watch as matrices break networks down into rows and columns! Individuals learn how a network can be represented as a matrix. They also identify the notation of matrices.
Curated OER
Lab Activity: Model of the Planets
This worksheet leads the class through the calculations needed to construct circles to represent the planets of our Solar System. The actual values are provided, as are suggested calculations to create the scale diameters. The ten...
Willow Tree
Linear Relationships
There's just something special about lines in algebra. Introduce your classes to linear equations by analyzing the linear relationship. Young mathematicians use input/output pairs to determine the slope and the slope-intercept formula to...
Curated OER
Tulip Graphing
Students create a graph of tulip growth. In this data analysis lesson, students plant tulip bulbs and use graph paper to begin graphing data on the growth of the tulip.
Curated OER
Interpreting Graphs
Sixth graders interpret linear and nonlinear graphs. They create graphs based on a problem set. Next, they represent quantitive relationships on a graph and write a story related to graphing.
Curated OER
Lines of Best Fit
High schoolers determine if there is an associationm in a scatter plot of data. They analyze data through predictios, comparisons, and applications. Students calculate the line of best fit using a graphing calculator. They display data...


