Kenan Fellows
Designing and Analyzing Data Collected from Wearable Devices to Solve Problems in Health Care
Wearable devices have become more the norm than the exception. Learners analyze data from a sample device with a regression analysis in a helpful hands-on lesson. Their focus is to determine if there is a connection between temperature...
Kenan Fellows
Reading Airline Maintenance Graphs
Airline mechanics must be precise, or the consequences could be deadly. Their target ranges alter with changes in temperature and pressure. When preparing an airplane for flight, you must read a maintenance graph. The second lesson of...
Curated OER
Graphing Data from the Chemistry Laboratory
High schoolers graph and analyze data using a spreadsheet.
TeachEngineering
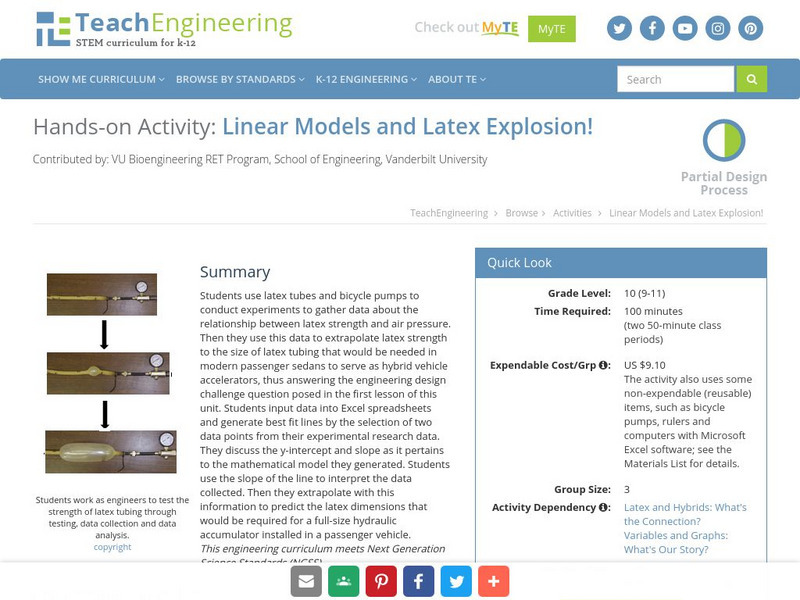
Teach Engineering: Linear Models and Latex Explosion!
Students use latex tubes and bicycle pumps to conduct experiments to gather data about the relationship between latex strength and air pressure.


