University of Colorado
University of Colorado: Ph Et Interactive Simulations: Least Squares Regression
Create your own scatter plot or use real-world data and try to fit a line to it. Explore how individual data points affect the correlation coefficient and best-fit line.
National Council of Teachers of Mathematics
Nctm: Illuminations: Linear Regression 1
An interactive program where students will explore regression lines. Students will be introduced to the correlation coefficient and come to understand what it represents through the given exploration. Requires Java.
Wolfram Research
Wolfram Math World: Correlation Coefficient
This is an elaborate site pertaining to the Correlation coefficient. The site begins with a brief introduction to what the correlation coefficient represents then goes into detail on how to find this value. The site has many links and...
CK-12 Foundation
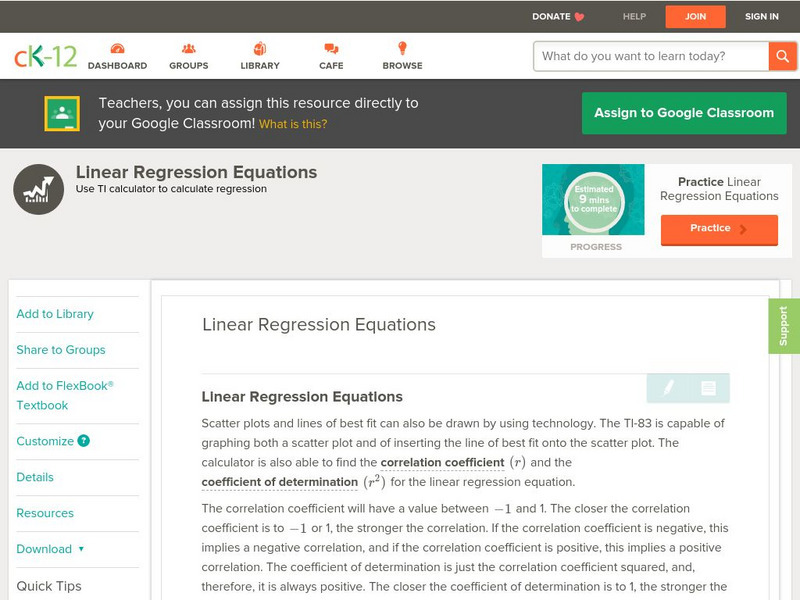
Ck 12: Statistics: Linear Regression Equations
[Free Registration/Login may be required to access all resource tools.] Use a calculator to create a scatter plot and to determine the equation of the line of best fit.
Texas Instruments
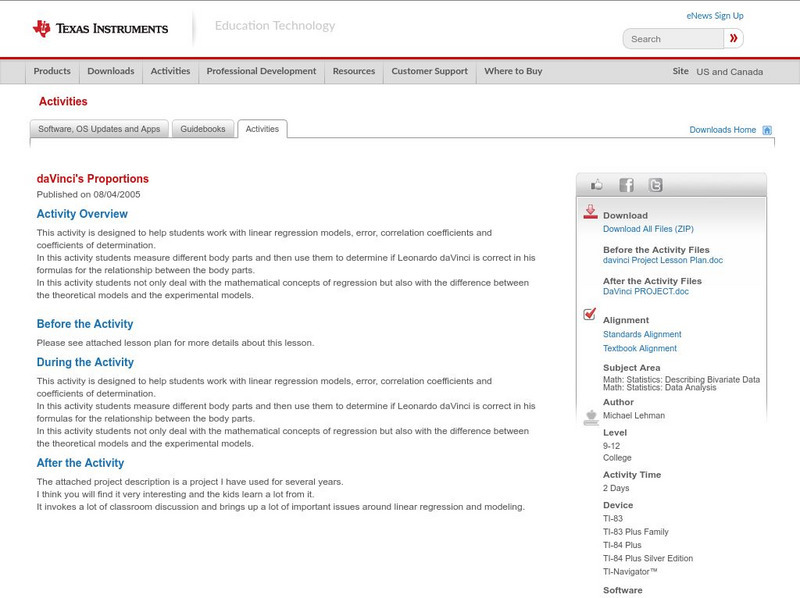
Texas Instruments: Da Vinci's Proportions
This activity is designed to help students work with linear regression models, error, correlation coefficients and coefficients of determination. In this activity students not only deal with the mathematical concepts of regression but...
Other
Stat Soft: Statistics Glossary
Dozens of statistical terms are defined and illustrated in this glossary.
Sophia Learning
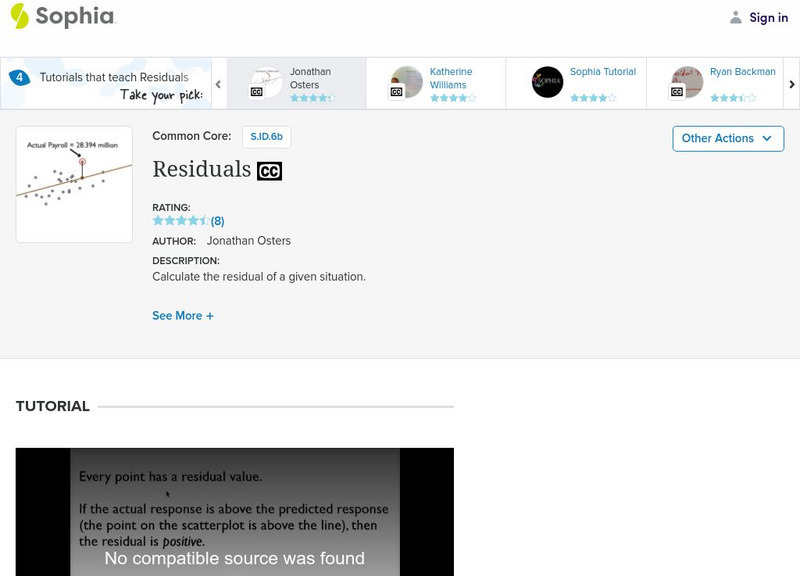
Sophia: Residuals: Lesson 2
This lesson will explain residuals. It is 2 of 3 in the series titled "Residuals."


