Hi, what do you want to do?
Curated OER
Measuring Length and Width
Second graders practice measuring length and width of objects in inches. In this measurement lesson, 2nd graders use a ruler to measure the length and width of a chair, desk, and book. Students view a video, "Math Investigations II," to...
Curated OER
Careers in Science
Pupils learn the trends in the current job market for scientists,
find where the jobs are, the range of salaries, and the job requirements.
They discover that scientists do some very interesting things, then
write a letter of...
Curated OER
Time and Cycles - Dendrochronology
Students investigate the lives of trees by examining ring cycles. In this plant life lesson, students identify the field of study known as dendrochronology and discover its history. Students investigate a simulated tree ring...
Curated OER
Understanding Cloud Formation
Students explore air and clouds by watching demonstration. They perform an experiment to measure air pressure changes.
Curated OER
A Cultural Palette
Students examine pieces of music and art that represent who they are. They study Haitian culture and traditions by performing the musical production "Once on the Island." They watch and discuss the film "The Nature of Music."
Curated OER
Mapping a Stream
Students map an actual local waterway. They create full color scale drawings that include windfalls, plant cover, streambed composition, and landmarks such as trees, boulders, and slumps. This is a long-term project that involves...
Curated OER
Rain Drops Keep Falin' On My Drainage Basin
Students compile information about rainfall, lake elevations and releases of water from Tuttle Creek reservoir into maps, graphs and charts.
Curated OER
Making Sense of Journey North Maps
Students use maps and answer core curriculum questions in order to increase comprehension and practice higher order thinking skills. This helps them develop writing skills through the practice of keeping Science Journals.
Curated OER
Map-Making Basics
Students study maps. In this geography and art lesson, students create their own map of the classroom.
Curated OER
Careers in Science
Stuents explore the current job market for scientists. They explore types of jobs, salary range and job requirements. Students write a letter of application for a particular job.
Curated OER
Com-Post With Us?
Learners discuss the importance of reducing, recycling and reusing materials to help the environment. As a class, they create a worm bin and observe how it turns material in to compost. They use the internet to research the...
Center for Innovation in Engineering and Science Education, Stevens Institute of Technology
Ciese Real Time Data Projects:collecting Weather Data and Keeping a Weather Log
Over a period of two weeks learners will use their class-made instruments to measure and record weather data. Students will also compare their data to online weather data. The final activity involves analyzing the collected data to look...
Illustrative Mathematics
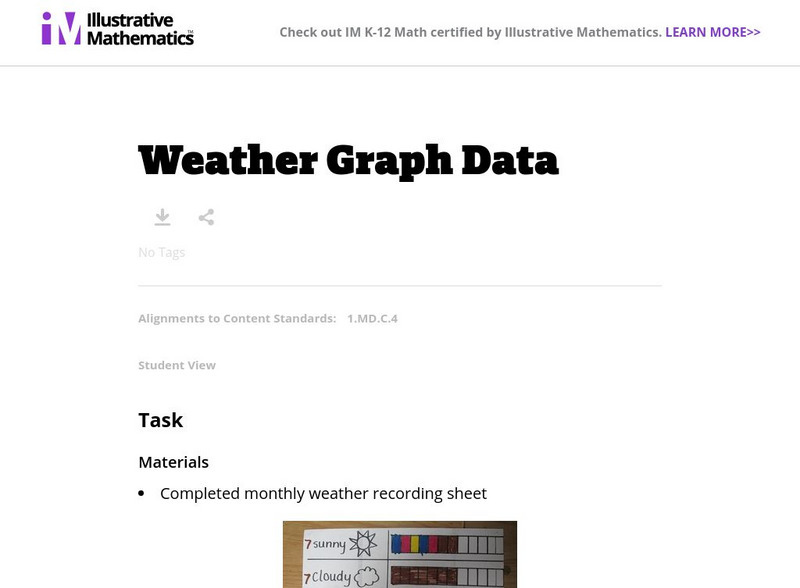
Illustrative Mathematics: Weather Graph Data
The purpose of this task is for students to represent and interpret weather data, as well as answer questions about the data they have recorded. Student worksheets and recording sheet are included.
Scholastic
Scholastic: Gather Data: Experiment With Weather
Simple guidelines for building several weather-related tools: anemometer, wind vane, barometer, rain gauge, snow gauge, and thermometer. After building your tools, follow experiment steps and record your findings on the Scholastic...
Science Education Resource Center at Carleton College
Serc: Classroom Phenology: The Environment a Source of Data and Observations
A unit where students record daily temperatures, precipitation amounts, observations of weather patterns, shadow length of a set object, and other observations. In addition, they will complete a season-long weekly observation of a...
Better Lesson
Better Lesson: Exploring Weather One, Two, Three, Forecast!
Students will use weather data they collect to predict future weather. Included in this lesson are a weather forecasting recording sheet and an example of a student's completed work.
University Corporation for Atmospheric Research
Ucar: Project Sky Math
Teachers will be interested to explore the SkyMath module, and the 16 classroom activities at this site. In this program, students will collect and record real-time weather data to analyze. Data analysis, graphing, number relationship,...
Alabama Learning Exchange
Alex: Charting the Weather
During this lesson, students will gather data from temperature and water gauges set up on the playground to learn about weather patterns. Then students will build a spreadsheet with data related to temperature, wind direction and amount...
Scholastic
Scholastic: Analyze: Forecast the Weather
Choose a weather-related topic, view the map, then make your own weather forecast.
Science Education Resource Center at Carleton College
Serc: Recording the Weather Around Us Using a Science Notebook in Second Grade
In this investigation, students will observe the weather and use weather terminology to document data in a science notebook. They will continue to observe and record their weather data throughout the year, looking for changes due to...
Alabama Learning Exchange
Alex: Weather Detectives
This is an introductory lesson to a second grade weather unit. The students will be observing the weather each day for one week and recording their observations in a chart. The students will be integrating information from the Internet...
American Geosciences Institute
American Geosciences Institute: Earth Science Week: Step by Step Weather Observations
Students act as citizen scientists and take and record the local temperature, and compare it with national readings.
Science Education Resource Center at Carleton College
Serc: Phenology Weekly
A long-term project lesson plan where students observe seasonal changes by recording observations and data of the weather conditions. Students will understand how to use a light meter, thermometer, anemometer, and rain gauge with this...
NOAA
Noaa: Storm Tracks
Monitor the evolution of storms in the northern and southern hemispheres using data such as sea level pressures, wind speed and wave height. Records go back as far as 90 days.


