Illustrative Mathematics
Illustrative Mathematics: Weather Graph Data
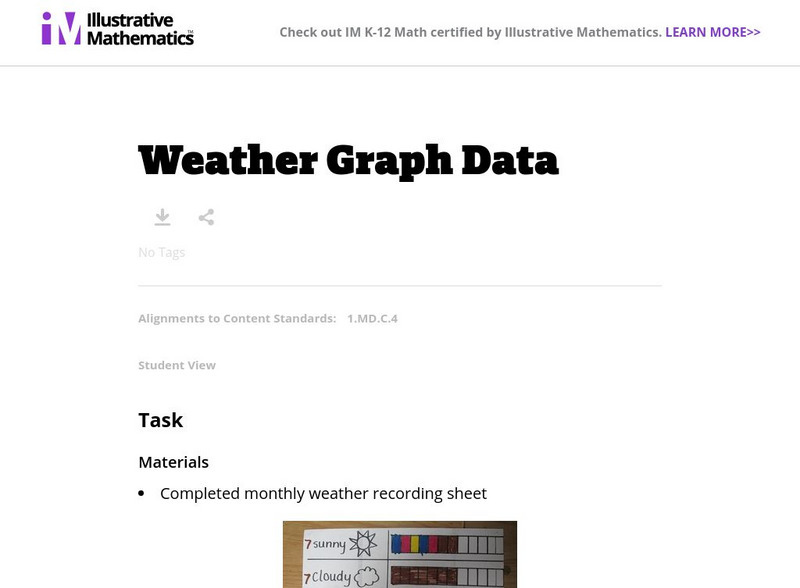
The purpose of this task is for students to represent and interpret weather data, as well as answer questions about the data they have recorded. Student worksheets and recording sheet are included.
Science Education Resource Center at Carleton College
Serc: Classroom Phenology: The Environment a Source of Data and Observations
A unit where young scholars record daily temperatures, precipitation amounts, observations of weather patterns, shadow length of a set object, and other observations. In addition, they will complete a season-long weekly observation of a...

