Hi, what do you want to do?
Curated OER
Building a Scale Model
Third graders create a model of the solar system. In this solar system lesson, 3rd graders create a scale model of the solar system. Working in pairs students solve mathematical problems to correctly measure the distance each planet is...
Curated OER
Chills And Thrills
Students learn what happens when ice melts. They explore melting, and devise ways of speeding up and slowing down the melting process.
Curated OER
Mean and Median
Students define mean and median. In this "average" lesson, students calculate the mean and median for a list of given numbers.
Curated OER
Ecology - Biodiversity Lab
Studnents examine the degree of biodiversity that exists in one's everyday environment, in order to develop an understanding of how scientists classify organisms and to explain why biodiversity is important for living things.
Curated OER
Curiosity Does Not Kill The Cat
Students list the different ways they could test a guinea pig, a dandelion, and their brother (or sister)? They create a data chart in their group that lists the organism, what they could measure, and how they could change that measurement.
Curated OER
Modeling With Quadratics
Students investigate quadratics through word problems. In this algebra lesson, students models the number of registered males in apprenticeship programs. They investigate the transformation of quadratic function on a coordinate plane.
Curated OER
Using Linear Models
In this Algebra II learning exercise, 11th graders examine models whose behavior can be described by a linear function. The four page learning exercise contains explanation of topic, three guided problems, and eight practice...
Curated OER
Heathly Foods Makes Heathly Body
Students examine and identify foods on the food pyramid. They catergorize food and place them on the correct level. They discover why they should eat foods in moderation.
Curated OER
Water Pressure - Disparity of Resources
Students examine the disparity of resources between developing and industrialized nations, and research the problem of water availability as world populations increase and natural resources are stressed.
Curated OER
The Statistics of Coins
Middle schoolers use skills of observation, recording, and calculation to provide an overview of years of cents (pennies) in circulation in the local area.
Curated OER
Green Leaves
Third graders, after having conducted one experiment three times, record their observations results in a chart. They predict what hidden colors they believe that a leaf holds. Students record their predictions in their science note books...
Curated OER
Weather Or Not
Students use the internet to find pen pals to share in their weather experiment. Individually, they research the high and low temperatures for cities within the United States and email the results to their pen pal. They also develop a...
Curated OER
Mapping the Ocean Floor
Students study the bottom structure of underwater habitats and how they can be mapped.
Curated OER
It's A Gas
Students build an organic waste methane generator and learn by running a scientific experiment to see what happens when people alter nature's way of recycling.
Curated OER
Smallest to Tallest - Where is the Middle?
Third graders measure each other's height and find the mean, median, and mode for the height of students in their class. They line up tallest to shortest and discuss the most appropriate measure of central tendency for the class.
Curated OER
The Talking Earth: a Research Lesson
Fifth graders read the book, "The Talking Earth" and research an animal that is found in the Everglades.
Curated OER
Conducting A Survey
Students identify the types of information gathering styles and different surveying styles. They distribute a survey around your school to determine the different forms of transportation used to get to school.
Curated OER
Can You Dig It?
Young scholars investigate a fossil site and diagram a site map. They role play as paleontologists.
Curated OER
WATTS UP?
Second graders research the Internet as they classify different forms of energy, investigate electrical energy and how to conserve energy.
Curated OER
Good Vibrations
Students demonstrate sound waves and make changes in the waves
resulting in changes in pitch. Students associate changes in pitch in various "musical instruments"with size and shape and the sound waves they produce.
Curated OER
The People Behind the Numbers
Tenth graders brainstorm potential definitions for "developed" and "developing" countries. They work in groups of four and research using Web sites listed to find information about their country then they create a spreadsheet which...
Vision Learning
Visionlearning: Data: Using Graphs and Visual Data in Science
An explanation of how data can be turned into visual forms which can help people comprehend information easier than observing numbers.
National Center for Ecological Analysis and Synthesis, University of California Santa Barbara
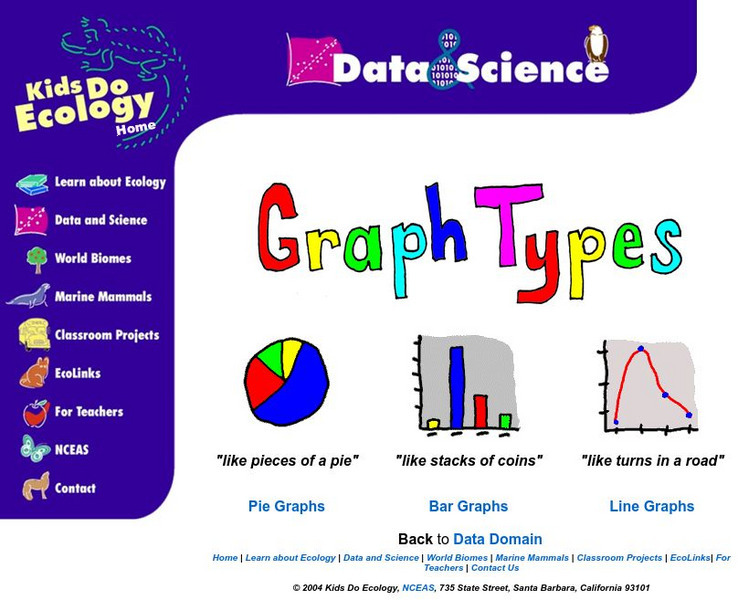
Nceas: Graph Types
At this site from NCEAS you can learn how to organize your data into pie graphs, bar graphs, and line graphs. Explanations and examples are given of each graph along with several questions that check comprehension.
Shodor Education Foundation
Shodor Interactivate: Misleading Graphs
This lesson will challenge students to think creatively by having them design and build water balloon catchers from random scrap materials, while requiring them to take into consideration a multitude of variables including cost,...


