Curated OER
Isolines on a Weather Map
Ninth graders recognize isolines on a weather map and draw isolines based on temperature data on a weather map. They draw isotherms on a weather map to identify temperature patterns.
Curated OER
Isolines on a Weather Map
Ninth graders explore weather by analyzing maps. In this temperature instructional activity, 9th graders view black and white weather maps of locations in which the weather changes often. Students identify the isolines used on the maps...
Curated OER
The Weather Page: Comparing Data
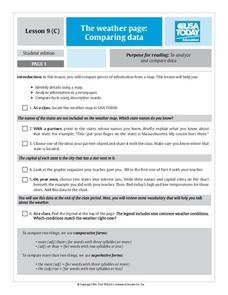
Students analyze data from maps. In this comparing data activity, students use comparative and superlative statements to draw comparisons among the weather in different American cities based on USA Today weather maps.
California Academy of Science
California's Climate
The United States is a large country with many different climates. Graph and analyze temperature and rainfall data for Sacramento and Washington DC as you teach your class about the characteristics of Mediterranean climates. Discuss the...
Curated OER
The Weather
Students explore earth science by reading articles in class. In this weather identification lesson, students analyze weather science articles on the Internet and view their own local weather patterns as well. Students define a list of...
California Mathematics Project
Meteorology
See how estimation is essential to making temperature weather maps. Scholars use ratios and rates of change to estimate temperatures at locations where temperature readings have not been made. They connect this idea to linear functions.
Curated OER
Weather Reporter
Fourth graders generate an oral presentation on the weather. In this weather lesson, 4th graders watch the weather for a week and record the data on a chart. Students give a weather report at the end of the week.
Curated OER
Observing Weather
Students investigate the weather by reading children stories. In this weather observation lesson, students read Cloudy With a Chance of Meatballs and several other stories about weather before they create a KWL chart....
Curated OER
Weather, Data, Graphs and Maps
Students collect data on the weather, graph and analyze it. In this algebra instructional activity, students interpret maps and are able to better plan their days based on the weather reading. They make predictions based on the type of...
August House
Go to Sleep, Gecko
Use this multidisciplinary lesson to delve into these subjects: English language arts, math, science, drama, and character education. After reading, discussing, and making interpretations about Go To Sleep, Gecko!: A Balinese...
Curated OER
Make Your Own "Weather" Map
Learners create their own "weather" map using data from x-ray sources. They analyze and discuss why it is important to organize data in a fashion in which is easy to read. They compare and contrast different x-ray sources using a stellar...
Curated OER
Right Place, Right Time
Fourth graders complete mathematical word problems. They study the relationships among distance, speed, and time; and measure travel distances. They measure distances using a piece of string and a ruler and practice converting several...
Curated OER
Our City's Temperature
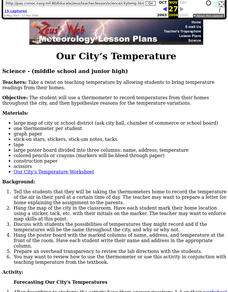
Middle schoolers use a thermometer to record temperatures from their homes throughout the city, and then hypothesize reasons for the temperature variations. They use a weather graph worksheet that's imbedded in this lesson to orgainize...
Curated OER
Studying Snow and Ice Changes
Learners compare the change in snow and ice over a 10 year period. In this environmental science lesson, students use the live data on the NASA site to study and compare the monthly snow and ice amounts on a map of the entire...
Curated OER
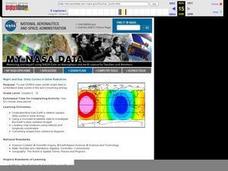
NIGHT AND DAY: DAILY CYCLES IN SOLAR RADIATION
Students examine how Earth's rotation causes daily cycles in solar energy using a microset of satellite data to investigate the Earth's daily radiation budget and locating map locations using latitude and longitude coordinates.
Curated OER
Infrared-Hot
Students describe how the sun heats the Earth, explain the nature of infrared light, explain how thunderstorms are formed and use infrared maps to predict severe weather.
Curated OER
Exploring Literature and Weather through Chirps
Students explore and experience information about temperature changes by using crickets' chirps to calculate the temperature. The data is applied to formula and the temperatures are calculated.
Curated OER
Science: Reading a Compass
Students demonstrate how to take bearings using a compass. In pairs, they select objects in the classroom then write down its first initial and bearing. They exchange papers and try to disciver their partner's object.
Curated OER
Temperature High and Lows
Students gather high and low temperature readings through email. In this temperature graphing lesson, students use a spreadsheet to input data for a graph. students interpret the graphs to compare and contrast the data from different...
Curated OER
Balancing the Scales: Understanding Ratios
Students are introduced to the concept of ratios. In groups, they convert sets of numbers into a ratio. After practicing, they use the ratios and proportions to solve story problems. They also calculate map distances and discover map...
Curated OER
High Mountain Retreat
Learners explore and analyze atmospheric conditions for a high mountain retreat. They examine the relationship between altitude, atmospheric pressure, temperature and humidity at a particular location. In addition, they write reports...
Curated OER
Understanding Hurricanes and the ER-2
Students study hurricanes; in particular, what they look like, how they are formed, how they are categorized, how they are named, and how they are tracked. They examine the science of hurricanes as well as the mathematics of hurricanes.
Curated OER
Get Ready to Safely Transport
Fourth graders complete multi-curricular activities to learn about trucks and transportation. In this transportation lesson, 4th graders answer questions about specifics for the trucking industry including safety questions and...
Curated OER
Trouble in the Troposphere
Students Use data sets from MY NASA DATA to produce graphs comparing monthly and yearly ozone averages of several U.S. cities. They analyze and evaluate the data and predict trends based on the data. In addition, they discuss and...
