University of Georgia
Splat!
What does viscosity have to do with splatter? An activity shows that the viscosity of a substance is inversely proportional to the distance of its splatter. Learners conduct the experiment by collecting data, graphing, and analyzing...
Curated OER
Peer Review Form for Scientific Writing
A peer review form just for science? Specifically tailored for science writing, this resource asks editors to give detailed responses to questions about the relevance of the study, the clarity of the hypotheses, the methods, materials,...
Spectrum
Grade 5 Standardized Test Prep
Here you'll find a great sampling of practice standardized test questions organized into four sections: ELA, mathematics, social studies, and science. Help your learners become familiar with the types of multiple-choice questions...
Virginia Department of Education
Adaptation and Evolution
Um may be the atomic symbol for confusion, but it won't be needed in this lesson. Scholars rotate through seven stations completing experiments, hands-on activities, writing exercises, and analysis. Stations include material on...
Curated OER
Population Patterns
Students study patterns of population growth in an ecosystem and why populations must remain in balance. They interpret basic population graphs and suggest scenarios about different population growth patterns in an ecosystem.
Curated OER
Choose The Appropriate Graph
Fifth graders work in groups to investigate the proper use of a graph during a schoolyard ecology project. The challenge of the project is for students to choose the proper form of a graph. They gather data and conduct analysis with the...
Polar Trec
Who Will Melt First?
If the Greenland ice sheet melted, sea levels would rise by about 20 ft; if the Antarctic ice sheet melted, sea levels would rise by 200 ft. Scholars explore ice melting through the analysis of different ice samples, clean and dirty ice....
Curated OER
Think GREEN - Utilizing Renewable Solar Energy
Students use data to find the best renewable energy potential. In this solar energy lesson plan students import data into Excel and explain how solar energy is beneficial.
NOAA
Deep-Sea Ecosystems – Cool Corals
Young oceanographers research deep sea corals that thrive on chemosynthesis. The lesson focuses on the biology of the animal, preferred habitat, associations, and interactions.
Consortium for Ocean Science Exploration and Engagement (COSEE)
Climate Change Impacts on Blue King Crabs
Carbon dioxide is not only causing global temperatures to increase, it causes the oceans to become more acidic. Lesson focuses on the blue king crab and the fragility of the habitat due to climate change. Scholars create a concept map...
Curated OER
Earth Energy Budget Pre Lab
Learners explore energy by conducting an in class experiment. In this climate change instructional activity, students conduct a water vapor experiment in a soda bottle. Learners utilize graphs and charts to analyze the results of the...
Curated OER
Velocity
In this velocity worksheet, students solve 13 problems including finding acceleration of objects, forces on objects, velocity of objects and interpreting graphs of position vs. time.
Curated OER
Interpreting a Flowchart
Students examine insects place in a community. They discover the communities of insects.
Curated OER
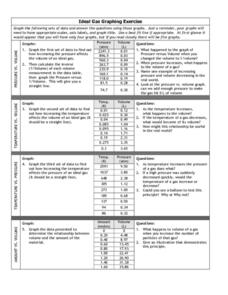
Graphing Exercise of Ideal Gas Data
For this graphing of Ideal Gas Data worksheet, students use the given data to draw 4 graphs of the given data. They are given the pressure and volume to draw and interpret the graphs.
Alabama Learning Exchange
Graphing Stations
Students explore the concept of graphing stations. In this graphing stations lesson, students head to various teacher set-up stations involving slope, point-slope, standard form, parallel lines, etc. Students work problems at...
Curated OER
Volcano Spreadsheet and Graph
Fourth graders use data from volcanoes to organize a spreadsheet and make a graph.
Curated OER
Graphing Data from the Chemistry Laboratory
Young scholars graph and analyze data using a spreadsheet.
Alabama Learning Exchange
We Love to Graph!
Students experience graphing points. For this graphing points lesson, students play an on-line game where they must name 10 coordinate pairs correctly. Students play a maze game where they maneuver a robot using coordinate...
Curated OER
How Many Cells Are Born in a Day?
Students predict the number of cells after a series of cell divisions. In this cells lesson students create a graph of their results and create a patterned drawing.
Curated OER
Observing Osmosis in a Chicken Egg
Tenth graders develop a hypothesis and explain what they observed on an activity. In this investigative instructional activity students observe osmosis and report their data using a graph.
ARKive
Handling Data: African Animal Maths
Handling and processing data is a big part of what real scientists do. Provide a way for your learners to explore graphs and data related to the animals that live on the African savannah. They begin their analysis by discussing what they...
It's About Time
Volcanic Hazards: Airborne Debris
Pupils interpret maps and graph data related to volcanic ash. Then they analyze the importance of wind speed and the dangers of the ash to both life, air temperature, and technology.
Curated OER
A Closer look at Oil and Energy Consumption
Upper graders analyze basic concepts about the consumption, importation and exportation of the worlds oil production. They create several graphs to organize the data and draw conclusions about the overall use of oil in the world.
Curated OER
Using Your Marbles - Volume Measurement and Reporting
Demonstrate how to measure the volume of liquids and solids immersed in liquid to your class. They observe a teacher-led demonstration, and in small groups construct a data table that demonstrates how many marbles were used and the...


