Curated OER
Asthma Survey
Students collect survey data on the prevalence of asthma in a community. They summarize and display the survey data in ways that show meaning.
Curated OER
Stock Market Game
Fourth graders are introduced to how the stock market operates. In groups, they practice reading and analyzing the Standard and Poor's 500 index. They participate in a simulation of buying and selling stocks on the market trying to...
Curated OER
Letters to the Government
Seventh graders examine how to be active participants in their local, state, or federal governments. They create a powerpoint presentation and write a letter to one of their governmental representatives about a problem and solution of...
Curated OER
Conceptualizing an Experiment
Students work together to design an experiment. They discover the origin of a family artifact. They analyze the data and discuss the results. They determine if the experiment is the best way to find out this type of information.
Curated OER
The Disappearing Honeybees: Tracking Honeybee Decline
Students practice graphing and other math skills to track number of honeybee colonies present in United States since 1978, discuss major crops that are dependent on insect pollinators, and examine reasons for decline of United States...
Curated OER
Function Composition
High schoolers solve two functions at once. In this algebra lesson, students add, subtract, multiply and divide composition functions. They use the correct notation and substitution to get their answer.
Curated OER
Lessons for Atlatl Users with Some Experience-Grade 6
Sixth graders experiment with an atlatl and dart. In this sixth grade data management mathematics lesson plan, 6th graders explore and determine the most suitable methods of displaying data collected from their experimentation with...
Curated OER
Hurricane Frequency and Intensity
High schoolers examine hurricanes. In this web-based meteorology lesson, students study the relationship between ocean temperature and hurricane intensity. They differentiate between intensity and frequency of hurricanes.
Curated OER
How Oceans Affect Climate
Students draw conclusions about how the ocean affects temperature. In this weather lesson plan, students use the Internet to gather data to help them come to a conclusion about how the climate in a certain region is directly affected by...
Curated OER
Building A Nation
Students build their own nation in groups where they create a name, flag, declaration of independence, form of government, mathematical layout, and more. In this nation lesson plan, students also provide a scale drawing of their nation...
Curated OER
The Study of Urban and Suburban Environments within the Mystic River Watershed
High school students examine their own water-based environments, within the Mystic Watershed. As the learners engage in inquiry-based, hands-on projects, critical thinking skills and problem-solving, the project will lead them to cross...
Curated OER
Cook Me Up Some Equations
Young scholars study a variety of math concepts in the context of cooking up a meal. In this math lesson, students calculate surface area and volume. They draw and interpret different types of graphs.
Curated OER
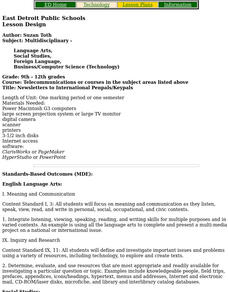
Newsletters to International Penpals/Keypals
Students participate in an intercultural E-mail exchange throughout a semester. They send newsletter to international penpals/keypals.
Curated OER
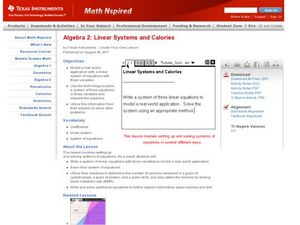
Linear Systems and Calories
Students define and graph properties of linear equations. For this algebra lesson, students write systems of equations to represent functions. They relate linear equations to the real world.
Curated OER
Pay Check Advance Loan
Students research loans. In this financial lesson plan, students explore the benefits and drawbacks of applying for a pay-day advance loan. Students compare different programs and calculate interest owed. Multiple resources are provided.
Alabama Learning Exchange
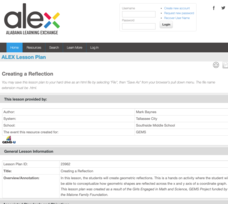
Creating a Reflection
Investigate geometric reflections in this geometry lesson. Create geometric reflections that show the reflection across the x and y axis of a coordinate graph. Learners watch a teacher demonstration before proceeding on their own. They...
Curated OER
200 Years and Counting: How the U.S. Census Tracks Social Trends
Students examine the process of census taking in the United States. In this "200 Years and Counting" lesson, students examine the data collection process, look at an example of a census form, analyze data, and learn what the information...
Curated OER
How Far Did They Go?
Students create a map. In this direction and distance lesson, students come up with familiar places in the community and calculate the distances from these places to the school. Students create a map that displays these places and their...
Curated OER
Weather Maps
Students interpret information on a weather map in order to construct a graph, and discuss how the weather impacts their lives.
Curated OER
Outbreak!
Eleventh graders explore the spread of a disease through a population. In this Algebra II lesson, 11th graders analyze graphical data representing they spread of a disease. Students produce a graph of the virus data,...
Curated OER
Measuring Velocity
Learners calculate their classmate's velocity using a mathematical formula. In this physics lesson, students graph the motion. They interpret the slope of the graph.
Curated OER
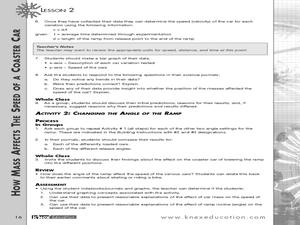
How Mass Affects the Speed of a Coaster Car
Learners determine what factors affect the speed of the car. In this physics instructional activity, students calculate speed, velocity and acceleration from experimental data. They construct and interpret motion graphs.
Curated OER
Dental Impressions
What an impressive task it is to make dental impressions! Pupils learn how dentists use proportional reasoning, unit conversions, and systems of equations to estimate the materials needed to make stone models of dental impressions....
Achieve
Ivy Smith Grows Up
Babies grow at an incredible rate! Demonstrate how to model growth using a linear function. Learners build the function from two data points, and then use the function to make predictions.

