Curated OER
Using Current Data for Graphing Skills
Students graph demographic information. In this graphing lesson plan, students choose what type of graph to create and what information to display. Links to examples of graphs and statistical data are provided. The graphs are created on...
Curated OER
Water: On the Surface and in the Ground
Students explore the differences between surface water and ground water. They collect data using maps and graphs and investigate a Texas river basin and a nearby aquifer. They complete a written report including maps and data regarding...
Alabama Learning Exchange
Explore the Transformations of Linear and Absolute Value Functions Using Graphing Utilities
Students explore the concept of transformations. For this transformation instructional activity, students use an applet that is an interactive absolute value graph applet. Students manipulate the applet to examine the change...
Curated OER
What Pie?
Students practice making and interpreting pie graphs so they are better able to decide if a pie chart is the appropriate form of display. Students examine included overheads of different pie charts, and directions on how to make pie...
Curated OER
My Peanut Butter is Better Than Yours!
Students explore the concept of statistical data. In this statistical data lesson, students read an article about the dangers of peanut butter to those who are allergic. Students perform a taste test of two different brands of peanut...
Alabama Learning Exchange
The State Capital of Stem and Leaf
Students explore the concept of stem and leaf plots. In this stem and leaf plots lesson, students plot the 50 US states' capitals on a stem and leaf plot according to the first letter of each state. Students compare...
Curated OER
Don't Let Parabolas Throw You
Students identify relation, function, patterns and range. For this algebra lesson, students factor and graph quadratic equations. They use transformation to move the parabola around and make predictions.
Curated OER
Thanksgiving Feast (Read the Charts)
Students practice reading charts about foods country of origin. They interpret information and answer questions related to charts. They discover how food production adds to the economy.
Curated OER
Find The Other Half
In this science worksheet, students interpret the graphs for the information that is related to measuring the different wavelengths for light or sound.
Curated OER
How Do Geology and Physical Stream-bed Characteristics Affect Water Quality?
Students examine geological bedrock in landscape regions and collect data. In this investigative lesson students retrieve data on the Internet then interpret, and graph it.
Curated OER
Line of Best Fit
Learners explore the concept of linear regression. In this linear regression lesson, students do a Barbie bungee activity where they collect linear data. Learners plot their data using a scatter plot. Students determine a line of best...
Curated OER
Coral Bleaching in the Caribbean
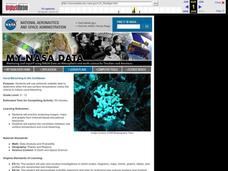
Students use authentic satellite data on the NASA website to determine when the sea surface temperature meets the criteria to induce coral bleaching.
Curated OER
Science: Hurricanes As Heat Engines
Learners conduct Internet research to track the path of Hurricane Rita. They record the sea surface temperature of the Gulf of Mexico during and after the hurricane and draw conclusions about how hurricanes extract heat energy from the...
Curated OER
In Line with Time
Third graders create a timeline of inventions and inventors made out of light colored bulletin board paper.
Curated OER
A Steep Hike
Students explore slope. In this middle school mathematics lesson, students analyze and interpret graphs as they investigate slope as a rate of change. Students use a motion detector to collect data as they walk at different...
Curated OER
Pie Chart: Favorite Animal at the Zoo
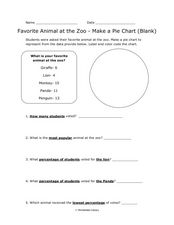
In these three interpreting a pie chart and answering questions worksheets, students use the data provided to label and color code the blank and outlined pie charts, read and interpret a completed pie chart, and then answer questions...
Nuffield Foundation
Intrepreting Information about Sweating and Temperature
Why do we sweat? Scholars analyze data about body temperature, sweating, and other factors to better understand sweating. They note the changes after drinking ice water to sweating, skin temperature, and body temperature. Analysis...
Curated OER
Population Biology - Biology Teaching Thesis
Students explore the effects of different density-dependent and density-independent factors on population growth. They explore how the interactions of organisms can affect population growth. Students explore the pattern of population...
Tech Museum of Innovation
Human Body Exhibit
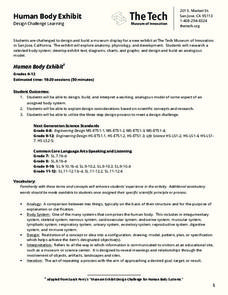
Explore human anatomy and physiology using models. Scholars study systems of the human body and design a display for a museum exhibit. To complete the activity, individuals create analogous models of their chosen human body systems.
Curated OER
Module 7 Revision Guide - Chemistry
Two versions of this handout are provided, the second with more detailed information on the same topics. Chemistry aces survey chemical reactions, heat energy transferred, and the action of enzymes by reading this resource. You can...
Curated OER
Mystery Liquids: Linear Function
High schoolers determine the linear equations of the density of water and oil by collecting data on the mass of various volumes of each liquid. They construct scatter plots from the data and use these to write the linear equations for...
Curated OER
Discovering Different Types of Functions
Graph polynomials and identify the end behavior of each polynomial function. The class differentiates between linear, quadratic, and other polynomial equations.
Curated OER
Analyzing the Relationship between Snowpack and River Flow
Students use the Internet to research current and past snowpack levels and river gauging station readings. They determine the relationship between snowpack and river flow. They predict future river flow.
Curated OER
Death by Particles
Emerging epidemiologists define relative risk and read an article about the effect of particulate pollution on the cardiovascular health of women. They record the relative risk values, graph them, and answer analysis questions. This is a...


