Curated OER
Chemical or Physical Change?
Eighth graders participate in several science activities to note chemical or physical changes after discussion. They understand that all matter has definite structure which determines physical and chemical properties.
Curated OER
Evaluating Data
In this data activity, students learn how to organize the data collected during an experiment and practice finding patterns. Students graph a table of experimental data and complete 1 short answer question.
Curated OER
Web-search And PowerPoint Presentations-The Cell
Sixth graders create a PowerPoint presentation using information that they have compiled from their web search and rubric web sites, text and other applicable references. They work in pairs to complete these searches and projects.
Curated OER
HOW FAST DO SEDIMENT GRAINS OF DIFFERENT SIZES SETTLE?
Students conduct an experiment using sand, a jar, and a paper clip to analyze the effects of different kinds of sand vis a vis its sediment. They graph their findings and analyze for factors of size, shape, and density.
Curated OER
Look At Those Leaves!
Students observe, measure, and sort tree leaves. They examine leaves individually, in groups, and in relationship to the entire tree. Pupils take a walk outside for a "Leaf Walk." Students are each given a lunch size paper bag, so that...
Curated OER
Arthropod Data Collection
Students describe the life cycle of various bugs as well as their predators and feeding habits. The class participates in a discussion of the various methods scientists use to gather data including research and experiment. After...
Curated OER
Worm Weather Predicted
Students examine worm habitats. In this animal habitats lesson plan, students participate in a lab activity that requires them to explore the adaptations that earthworms make to their environment.
Curated OER
Introduction to Seeds
Students investigate how to plant a seed. In this gardening lesson, students listen to the book I'm a Seed and research the materials needed to plant a seed. Students present the information they found.
Curated OER
Art and Anatomy: The Vitruvian Teen
Students are introduced to the history of showing the human anatomy. In groups, they measure their height and arm spans to create a graph and determine if their measurements support Vitruvius' work. Individually, they make their own...
Curated OER
Using a Thermometer
First graders use their senses to formulate questions and make predictions to determine what is in the "Wonder Bag". They hold pieces of ice and examine while listing descriptors on a chart and then take their own temperature using an...
Curated OER
Linkages Between Surface Temperature And Tropospheric Ozone
Students collect and interpret data to make predictions about the levels of ozone in the atmosphere. Using the internet to collect data students use their collected data to create a line graph for analysis. Students make mathematical...
Curated OER
Now You See It, Now You Don't
Students determine their eye's blind spot. In this biology activity, students explain what causes this visual deficiency. They give real life applications of this concept.
Curated OER
Mathematics and Ecology: Through the Window Garden
Student discover some of the ideas and concepts that make up the topic of Ecology. They read and interpret graphs to assimilate the information that is displayed. They discover the rate of increase of Carbon dioxide in the atmosphere...
Curated OER
Wetlands: Pave or Save?
Young scholars discuss the characteristics of wetlands and how to make them more productive. Using a map, they locate the major wetlands in the United States and color them using a key. They read an article and in groups answer...
Curated OER
Observing and Predicting Weather from a Weather Station
Fourth graders us a Weather Log data chart to record the date, time, day, and weather. They discuss different instruments and charts needed to record the information. Students turn in their weather logs at the end of two weeks and...
Curated OER
Magnets
Students investigate the magnetic attraction of different materials by observing a demonstration, and review the words "attraction" and "materials." Next they conduct exploration of a number of materials which have different properties...
Curated OER
Invasion of the Germs: We Fight Back!
Students fight off germs. In this technology skills lesson, students create claymation videos with accompanying podcasts that educate others about the H1N1 virus and methods to fight germs.
Curated OER
Are Enzymes Specific for Their Substrates?
Students discover enzyme to substrate specificity. The experiment uses samples of glucose and lactose in combination with the enzyme lactase. Students observe the reaction between the lactose and the lactase; the lack of a reaction...
Curated OER
Remote Sensing
Ninth graders participate in a variety of activities designed to reinforce the concept of light and the electromagnetic spectrum. They research and analyze data from remotely sensed images. They present their findings in a PowerPoint...
Curated OER
Water: Float and Sink
First graders work in small groups to observe the tendency to float or sink for a variety of objects in water. They sort the objects and discuss their observations. They use aluminum foil to construct a boat and test it for weight capacity.
Curated OER
Particle Physics- Activity Five
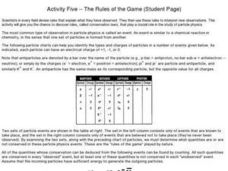
In this particle physics worksheet, students use graphs and tables to predict the particles formed during a specific observation event. They complete 5 multi-part fill in the blank questions.
Curated OER
How Does Your Garden Grow?
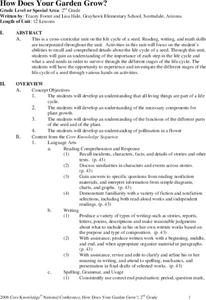
Students complete activities to learn about the life cycle of a seed. In this plant growth lesson, students complete activities for the life cycles of seeds.
Curated OER
Newton's Laws of Motion
Students investigate the effect of thin films to surface friction. In this physics lesson, students calculate the coefficient of friction using mathematical formulas. They discuss its importance in their everyday lives.
Curated OER
Creation and Interpretation of Voter Participation Graph
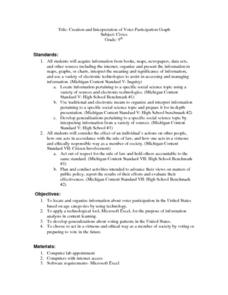
Ninth graders research information about voter participation in the United States based on age. They develop generalizations about voting patterns in the U.S and use Microsoft Excel to analyze the information.


