Curated OER
What Color is Your Air Today?
Students investigate air quality. They analyze Air Quality Index data tables, interpret the graphs, complete a worksheet, and discuss trends in air quality.
Curated OER
Finding an Earthquake's Epicenter
Students examine the process used to identify the epicenter of an earthquake. They identify the Richter scale and interpret a seismograph reading. They also view photographs of the aftermath of earthquakes.
Curated OER
Snow Cover By Latitude
Students create graphs comparing the amount of snow cover along selected latitudes using data sets from a NASA website. They create a spreadsheet and a bar graph on the computer, and analyze the data.
Curated OER
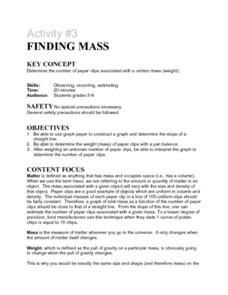
Activity #3 Finding Mass
Students use graph paper to construct a graph and determine the slope of a straight line. They determine the weight (mass) of paper clips with a pan balance. Pupils weigh an unknown number of paper clips, and to interpret the graph to...
Curated OER
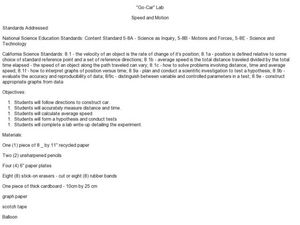
"Go-Car" Lab
Students construct a car based on directions given. In this physics lesson, students calculate average speed using distance and time information. They collect data and create a graph of distance vs. time.
Curated OER
Weather v. Climate
Ninth graders discuss the differences between climate and weather as a class. Using data they collected, they create a graph of the data to share with the class over a specific time period. They compare and contrast this data with...
Curated OER
Down the Drain
Students explore what problems might occur if oxygen decreases in a body of water. They model what happens in a situation where decomposition is occurring. Students obtain, organize, graph, and interpret information. They i interpret...
Curated OER
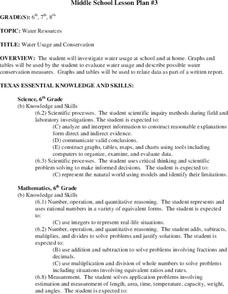
Water Usage and Conservation
Students investigate water usage at school and at home. They use graphs and tables to evaluate water usage. Students describe possible water conservation measures. They use graphs and tables to relate data as part of a written report.
Curated OER
SURVIVING A COSMIC INVASION
Young scholars read periodicals relating to radioacitivity and interpret a Geiger Counter. They work in small groups, share information and help each other explain the Geiger Counter. They discover the relationship distance to...
Curated OER
The Nutrients Public Transportation System
Students investigate the human circulatory system by experimenting with hoses. In this human body lesson, students create a system of hoses simulating the circulatory system which they utilize to pass objects through....
Curated OER
Active Wear
Middle schoolers interpret and analyze data. In this middle school mathematics lesson plan, students conduct an experiment in which they investigate which solar collector, black, white, or silver, absorbs the most heat. ...
Curated OER
Musical Plates
Students receive current data on the movement of plates on the earth's crust. These plates shift and the magnitude of their shift over time can be tracked. They track this velocity vector on a global map and determine the speed of the...
Curated OER
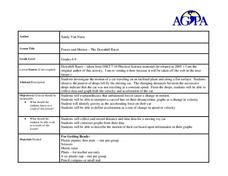
Forces and Motion-The Downhill Racer
Students calculate a toy car's velocity and acceleration. For this force and motion lesson, students build ramps and attach a dropper to a toy car, which is released down the ramp. Students calculate and graph velocity and acceleration...
Curated OER
Why Plants Are Important to Us
First graders explore plant life. In this plant lesson, 1st graders examine various plant life and categorize them. Students graph their data and make journal entries regarding their work.
Curated OER
$$$eaweed
Students compare and evaluate the world's different seaweeds. In this investigative instructional activity students study seaweed and the harvesting of it. They then interpret the data collected and graph the seaweed...
Curated OER
Tune...Um!
Learners collect real data on sound. In this algebra lesson, students use a CBL and graphing calculator to observe the graph created by sound waves. They draw conclusion about the frequency of sound from the graph.
Curated OER
Martian Sun Times
Students become weather reporters for the Martian Sun Times newspaper to gather. interpret, and compare current weather information for Mas and Earth. Final articles be posted on-line. There are seven investigations in this unit.
Curated OER
Using Radiosonde Data From a Weather Balloon Launch
Student use radiosonde data from a weather balloon launch to distinguish the characteristics of the lower atmosphere. They learn the layers of the atmosphere. They graph real atmospheric data.
Curated OER
Great Flathead Lake Ecosystem Mystery
Learners analyze data to solve the mystery of what contributed to an ecological disaster at Great Flathead Lake. They read and graph the available data, create a food web of the problem ecosystem, and construct a formal problem statement...
Curated OER
What is Climate?
Students explore the differences between climate and weather. In this introductory lesson plan of a climate unit, students discuss the vocabulary and concepts associated with weather and climate. They build their information base for...
Curated OER
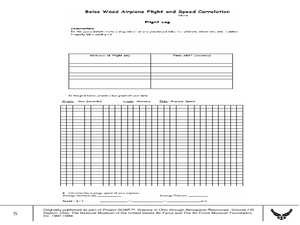
Balsa Wood Airplane Flight and Speed Correlation
Ninth graders calculate the average speed of their balsa wood airplane. In this physics lesson, 9th graders build their own airplane and make necessary modifications to to make it fly straight. They interpret distance and time graph...
Curated OER
Weather Report Chart
Students complete a weather report chart after studying weather patterns for a period of time. In this weather report lesson, students measure temperature, precipitation, cloud cover, wind speed, and wind direction for a month. Students...
Curated OER
Are you an Energy Saver STAR?
Learners examine how to use energy more efficiently in their own home. They collect data from their home, complete a chart, read a power meter, interpret the data from an electric and gas bill, and create a poster demonstrating how to...
Curated OER
Inertia
Students conduct an experiment to apply Newton's first law of motion. They observe the inertia of an object in regard to its mass. The students record and graph the outcomes of their investigation and present the relationship between...


