Curated OER
Temperature
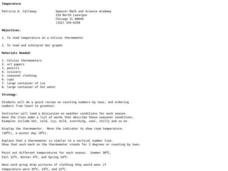
Students explore the concept of temperature. In this temperature instructional activity, students read thermometers in degrees Celsius. Students discuss the temperature of the seasons and what clothing they might wear given a certain...
Curated OER
Checking Test Comparability/Scattergrams
Students construct a scattergram graph. In this statistics lesson, students graph data by hand and using a spreadsheet program. They establish lines of best fit and draw conclusions using their graphs.
Curated OER
Pecan Power
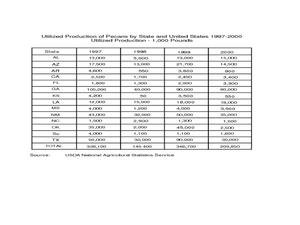
Students study the origins of pecans and complete a bar graph from the data they have discovered. In this pecan lesson plan, students draw pecans, discuss a pecan time line, and draw a bar graph comparing Arizona pecans to other...
Curated OER
Rock Art
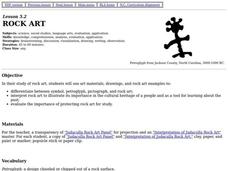
Fourth graders examine and interpret rock art to illustrate its importance in the cultural heritage of a people and as a tool for learning about the past. They create their own rock art that is a symbol of their culture.
Curated OER
Rock art
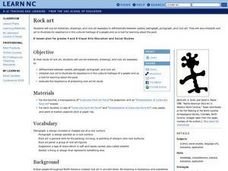
Students study rock art they use art materials, colored photographs and rock art examples to: differentiate between symbol, petroglyph, pictograph, and rock art. They interpret rock art to illustrate its importance in the cultural...
Curated OER
Hand Sensitivity
Students experiment with the sense of touch. In this tactile lesson plan, students determine the most sensitive area of the hand. Students experiment by describing objects through touch only. Students compare the amount of sensory data...
Curated OER
Aquatic Invertebrates
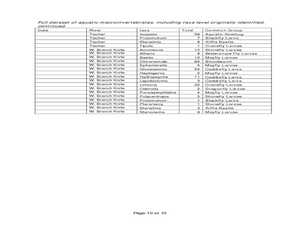
Students examine the impact that human development has on streams. In this stream sampling lesson students compare macroinvertebrate data and graph it.
Curated OER
Is There Liquid Water on Mars?
Students assess whether there is liquid water on Mars by analyzing images and data. In this planetary lesson students analyze temperature and pressure graphs and hypothesize about how water could have flowed on Mars.
Curated OER
Under the Sea - Ocean Mammals/Fish
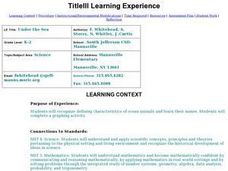
Students explore the similarities and differences between ocean mammals and fish. The characteristics of the life forms observed are placed onto a graph. The classroom becomes the botom of the sea and is explored to gain the required data.
Curated OER
Scatter Plots
In this Algebra I/Geometry/Algebra II worksheet, students create a scatter plot and analyze the data to determine if the data show any type of correlation. The four page worksheet provides extensive explanation of topic,...
Curated OER
An Introduction to Sensors
Students research the International System (SI) of units of measurements. They make measurements using the metric system. They study key concepts used in building and use of sensors, how sensors work and their role in measuring...
Curated OER
Water Pressure Experiments
Students perform experiments measuring water pressure. They record their observations after poking holes in plastic bottles filled with water with the lids on and then off. They discover the role gravity plays in the water flow.
Curated OER
Butterfly Adventure
Students in second grade are paired with fifth grade computer research buddies. They observe the characteristics of caterpillars, and identify the four stages of the caterpillar to butterfly life cycle. They graph the number of...
Curated OER
Slingshot Characterization Experiment
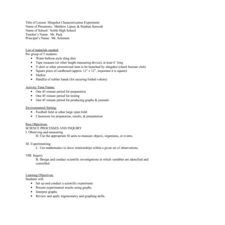
Students set up and conduct a scientific experiment to demonstrate data collection. In this scientific process lesson, students complete an activity with the specific objective of using a slingshot to fire a t-shirt into the crowd at a...
Curated OER
Insect Monitoring
Students participate in an interactive activity using the scientific method to study biodiversity. In this insect monitoring activity, students simulate the layers of soil and the insects that would live there. Students design...
Curated OER
Forest Activity: Interpreting a Graph
Pupils research forest growth online. They analyze the parts and contents of a graph, then summarize in narrative form the changes in the forest over time.
Curated OER
Driving Forces Forestry In Canada
Learners discuss the natural and economic impact of forests and forestry. Using given statistics they construct different types of graphs in which they make observations and draw conclusions.
Curated OER
Chances Are
Upper graders examine the concept of probability. They collect data and create a bar graph. They must interpret the data as well. Everyone engages in hands-on games and activities which lead them to predict possible outcomes for a...
Curated OER
Trouble in the Troposphere
Students Use data sets from MY NASA DATA to produce graphs comparing monthly and yearly ozone averages of several U.S. cities. They analyze and evaluate the data and predict trends based on the data. In addition, they discuss and...
Curated OER
Graphing Population Around the World
Students define specific vocabulary necessary for understanding population data. They collect, analyze, and interpret specific data. They utilize computer programs in order to create graphs of collected data.
Curated OER
Water in the Texas Coastal Basins
Students, after researching a Texas coastal basin, map and graph the information they collect and then translate it into a short report to be presented to their classmates. They brainstorm unique ways to maintain Texas estuaries as well...
Curated OER
Computer Graphing
Students research the Internet or create surveys to find graphable data. They collect, organize, analyze and interpret the data. Finally, they choose the appropriate type of graph to display the data and find the measures of central...
Curated OER
Graphing and Analysis of Water Quality Reports
Students practice making graphs and interpreting them. They compare and contrast different sets of data. They use Microsoft Excel to create different types of graphs.
Curated OER
Graphing Data - Temperature
Seventh graders measure and record temperature over a given time period. They compare the recorded temperatures to the 40-year recorded normal average temperatures for the same area. Students display and interpret their findings in a graph.
