Curated OER
The Night Before Christmas Graph
First graders graph their favorite The Night Before Christmas books. In this graphing lesson students listen to several versions of the the same story, The Night Before Christmas. The students each choose their favorite version and the...
Curated OER
Making a Line Graph
In this line graph worksheet, students use data given in a table and assign axes, make a scale, plot data and make a line or curve on their constructed graphs.
Curated OER
Making a Circle Graph of a Sample Budget
Students examine a sample budget and categorize the entries as a group. Then in small groups they convert budget category totals to percents and degrees to make a circle graph related to a sample budget.
Curated OER
Graphing with Stems-and -Leafs
Fourth graders examine the use of stem and leaf graphs. In this stem and leaf graph activity, 4th graders participate in teacher led activity showing the use of the graphs. They work in groups to collect data about peanuts before making...
Curated OER
Charts, Maps, and Graphs Lesson on the Holocaust
Students practice interpreting data. In this Holocaust lesson, students research selected Internet sources and examine charts, maps, and graphs regarding the Jewish populations in and out of Europe. Students respond to questions about...
Curated OER
Build A Skittles Graph
Students explore graphing. In this graphing lesson, students sort Skittles candies and use the color groups to create a bar graph. Rubrics and extension activities are provided.
Curated OER
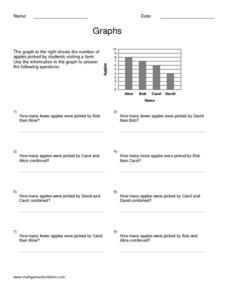
Graphs
In this graphing worksheet, students read information and study diagrams about graphing. Students complete 3 graphing activities.
Curated OER
Every Graph Tells A Story
Seventh graders explore linear equations. In this graphing lesson, 7th graders explore constant rates of change. Students discover the real-life application of graphs and demonstrate their ability to read graphs and write corresponding...
Curated OER
Impossible Graphs
Young scholars practice plotting functions on the Cartesian coordinate plane while participating in a discussion about the Possible Or Not worksheet/activity. Students also use the Impossible Graphs worksheet to practice reading a graph,...
British Council
Chocolate
Are you the biggest chocoholic? Scholars read text about people eating chocolate and sequence the text by putting them in order of who ate the most to least chocolate. They quiz classmates to discover who is the biggest chocoholic in the...
ReadWriteThink
"Three Stones Back": Using Informational Text to Enhance Understanding of Ball Don't Lie
"Three Stones Back," a passage from Matt de la Pena's best-seller, Ball Don't Lie, allows readers to practice their close reading skills as they compare the passage to an information text about wealth inequality.
Lied Center of Kansas
The Ugly Duckling and The Tortoise and the Hare
Both The Ugly Duckling and The Tortoise and the Hare are great additions to an elementary language arts lesson. Young readers focus on the literary elements of each story, including characters and plot development, and apply counting and...
Tennessee State Museum
Deciphering the Document: Unlocking the Meaning of the Emancipation Proclamation
Help your learners truly understand the Emancipation Proclamation by asking them the put it into their own words. After reading the document out loud to the class, and briefly discussing the legal language, split your class into small...
Alabama Learning Exchange
Tiger Math Graphing
Learners practice various skills using the book Tiger Math: Learning to Graph from a Baby Tiger. After listening to the story, they create a pictograph using data collected from the text. They also color a picture of a tiger, collect...
Curated OER
M & M Madness
M&M's are always a great manipulative to use when teaching math. In this graphing lesson plan, learners predict how many of each color of M & M's there are. They count up each color and plug the data into a graph using the...
Curated OER
Nutrition and Food Security
Examine the three basic nutrients and their effects on the body. Fifth graders will research data to construct a bar graph and then demonstrate the relationship between malnutrition and food security. This is a very comprehensive...
Curated OER
Show Me The Data!
Pupils create a bar graph. They will collect and organize data to turn into bar graphs. They create graphs for the favorite sports of the class, color of M&M's, and types of cars passing by.
Alabama Learning Exchange
Ice Cream Sundae Survey
Young scholars analyze data through graphs. They will complete a class survey on ice cream sundaes and tally and graph the responses. They then analyze the information from the class graph.
Curated OER
Science: Teddy Bear Nation
Students sort teddy bears according to types and then graph the results. They each bring a bear to class and then discuss their similarities and differences. Once the bears have been sorted into groups according to size and color,...
Curated OER
Environmental Agents of Mathematics: Mathematics for Change
High schoolers analyze environmental science data using Math. They do research about renewable energy, gather data, create graphs and interpret their findings. Then the group presents their arguments persuasively using their findings to...
Curated OER
How Soluble Is It?
Is sugar more soluble than salt? Experiment with water and solubility with an elementary science activity. After interpreting data from a bar chart, fifth graders use different types of sugar to determine if the size of sugar particles...
Curated OER
Survey Says...
Young statisticians collect, organize, and present data to illustrate responses to a survey question. They write and conduct the survey. They finish by presenting the results in the form of a graph.
Curated OER
Rescue Mission Game
Students conduct probability experiments. In this rescue mission lesson plan, sudents play a game and collect statistical data. They organize and interpret the data and determine the probability of success. Students plot points on a...
Baylor College
Living Things and Their Needs: The Math Link
Enrich your study of living things with these cross-curricular math activities. Following along with the story Tillena Lou's Day in the Sun, learners will practice addition and subtraction, learn how to measure volume and length, work on...


