Curated OER
Reading Graphs
Working independently or in teams, your class practices connecting graphs, formulas and words. This lesson includes a guided discussion about distance vs. time graphs and looking at how velocity changes over time.
Curated OER
Explore Learning Exponential Functions
High schoolers graph exponential equations and solve application problems using exponential functions. They re-enact a story about a peasant worker whose payment for services is rice grains doubled on a checker board. They place M &...
Curated OER
Exponential Functions
Students graph exponential equations of the form y=Ma. They understand the effects of M, a, and k on the graph. They solve application problems using exponential functions.
West Contra Costa Unified School District
Writing Exponential Functions Based on Data
Give your class a concrete example of exponential growth and decay using this hands-on activity. These Algebra II lessons allow for the exploration of exponential growth and decay models, as well as the discovery of the patterns of...
EngageNY
The Graph of the Natural Logarithm Function
If two is company and three's a crowd, then what's e? Scholars observe how changes in the base affect the graph of a logarithmic function. They then graph the natural logarithm function and learn that all logarithmic functions can be...
Howard County Schools
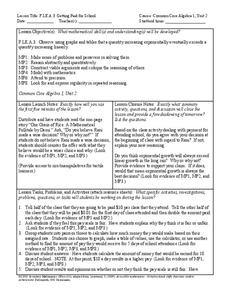
Getting Paid for School
What if you were paid to attend class? What kind of payment schedule would you choose? Learn how exponential functions will eventually exceed linear functions by comparing two different payment schedules for attending class.
EngageNY
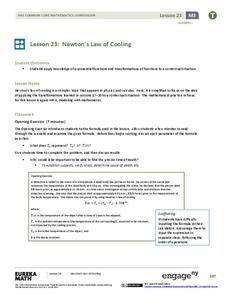
Newton’s Law of Cooling
As part of an investigation of transformations of exponential functions, class members use Newton's Law of Cooling as an exponential model to determine temperature based on varying aspects. The resource makes comparisons between...
West Contra Costa Unified School District
Average Rate of Change
Learners investigate average rates of change for linear functions and connect the concept to slope. They then determine average rates of change in quadratic and exponential functions.
Shodor Education Foundation
Graphing and the Coordinate Plane
Ready to introduce your class to the coordinate plane? This website includes a detailed lesson plan that includes two interactive games to help learners practice graphing ordered pairs. The scripted discussion is a little cheesy and a...
Curated OER
Logarithmic Functions
Learners explore the characteristics of logarithmic functions and their relationship to exponential functions. Using the subscriber website Explorelearning.com, pupils observe changes in the input variable and its effect on the graph of...
Curated OER
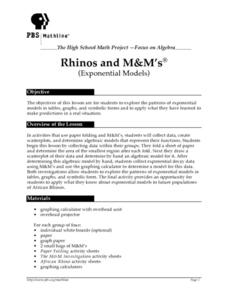
Rhinos and M&M's
High schoolers analyze patterns of exponential models by collecting data in paper folding and M&M investigations. They use graphing calculators to create scatter plots that lead to equations for the exponential models. They then...
Science Matters
Richter Scale
The 12th instructional activity in a series of 20 opens with a demonstration of exponential functions using pasta. This concept is connected to the Richter Scale, which is also an exponential function. Scholars compare the exponential...
Curated OER
Population Patterns
High schoolers study patterns of population growth in an ecosystem and why populations must remain in balance. They interpret basic population graphs and suggest scenarios about different population growth patterns in an ecosystem.
Curated OER
Graphing and the Coordinate Plane
Students gain practice reading coordinates and plotting points by participating in the Coordinates! Game. They demonstrate and test their skills with graph paper and the Maze Game.
Alabama Learning Exchange
Finding Prime
Fifth and sixth graders explore prime numbers. They work with a partner to build rectangular arrays using twelve tiles. Factor pairs are noted and recorded on graph paper. Pupils construct rectangular arrays with a prime number and...
EngageNY
Rational Exponents—What are 2^1/2 and 2^1/3?
Are you rooting for your high schoolers to learn about rational exponents? In the third installment of a 35-part module, pupils first learn the meaning of 2^(1/n) by estimating values on the graph of y = 2^x and by using algebraic...
Curated OER
Peter's Third String
Explore the solution to a word problem involving area and perimeter. Learners read and discuss how to approach the problem. In small groups, they determine the maximum area of a rectangle with a given perimeter using a piece of string....
Curated OER
Introduction to Graphical Representation of Data Sets in Connection to Cellular Growth
Students practice graphing relationships between variables by studying topics such as exponential growth and decay. They conduct a series of numerical experiments using a computer model and a variety of physical experiments using mold,...
Curated OER
The Mister Runtles' Bet
Students listen to a story dealing with exponential and linear growth. After reading the story, students complete a table comparing information. Using a calculator, students graph the rice and daily population of flies. They study the...
Curated OER
Spreadsheet Activity
Students create a spreadsheet to match a given sample. This includes adjusting column width and row height, changing alignment, changing size and style of print, changing number format.
Curated OER
Getting Out of Line
Students explore basic connections between graphs, tables, and symbolic representations for lines, parabolas, inverse models, and exponential models. One of the primary goals of this lesson is to help students begin to recognize patterns...
Curated OER
Count The Letters
Young scholars perform activities involving ratios, proportions and percents. Given a newspaper article, groups of students count the number of letters in a given area. They use calculators and data collected to construct a pie chart...
Curated OER
The Good, The Bad, The Ugly
Sixth graders examine the causes of the stock market crash of 1929. In this integrated math/history unit on the stock market, 6th graders study, research, and read stocks, visit a local bank, and create a PowerPoint to show the...
EngageNY
Creating and Solving Quadratic Equations in One Variable
Give your classes practice at modeling using quadratic models with a resource that uses area and integer problems to allow individuals to create second degree polynomials. Young mathematicians solve equations using factoring and then...


