Hi, what do you want to do?
Other
Kim's Korner: Graphic Organizers for Writing and Reading
What are graphic organizers for reading and writing? Use this site to learn more about these learning tools.
Florida Center for Reading Research
Florida Center for Reading Research: Essentials for Reading Success
This site offers three cyclical flow charts of the essentials for reading success: components of reading, types of assessment, and layers of instruction.
Primary Resources
Primary Resources: Line Graphs and Pie Charts
Here are a few resources to use with your students when teaching about line graphs or pie charts.
E-learning for Kids
E Learning for Kids: Math: Tea Store: Reading a Table
Students will demonstrate how to interpret information in a table.
English Zone
English Zone: Chart Reading Practice 1
Practice reading and understanding information when it is provided in chart format. This website provides a simple chart and asks questions about the chart's information, which can be answered and checked.
Other
The Elephant Sanctuary
Learn about the facility, view live and archived videos of the resident elephants and learn their histories and that of elephants in general. Visit the photo gallery and read the newsletter and other news from "around the globe". In...
Texas Education Agency
Texas Gateway: Analyze Graphical Sources: Practice 2 (English I Reading)
Analyze the factual, quantitative, and technical data in graphs and charts.
English Zone
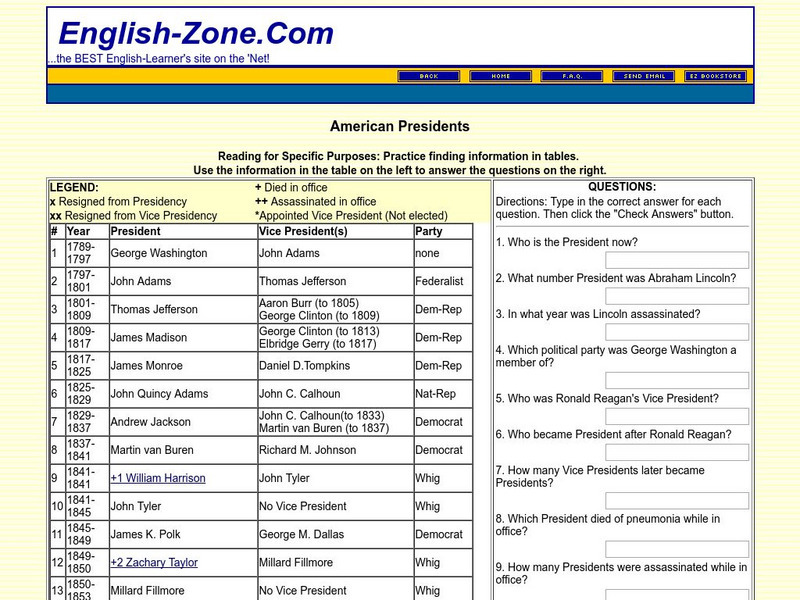
English Zone: American Presidents: Reading for a Specific Purpose
In this activity, information about American presidents is provided in chart format on the left and asks students to use the chart to answer the questions on the right. Note: the last president listed is George W. Bush. Java is required.
American Museum of Natural History
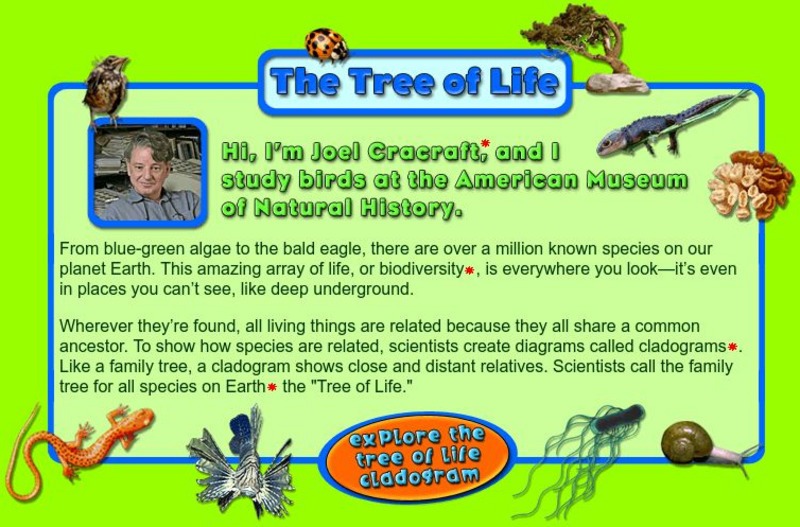
American Museum of Natural History: O Logy: The Tree of Life
Learn about the diversity of species on Earth by exploring a cladogram, a graph-like tree of life that illustrates relatedness among species. Includes instructions for reading cladograms and a pie chart that summarizes the percentages of...
Other
Hhs: Physical Activity Fundamental to Preventing Disease
Here, read statistics from the US Department of Health and Human Services concerning exercise and its key role in preventing chronic illness and premature death. Use these findings from medical studies in which diseases were studied in...
Florida Center for Reading Research
Florida Center for Reading Research: Exp. Text Structure: Text Feature Find
A lesson plan in which students look through a book to find various text features including: a table of contents, sequence and format, charts/graphs/maps, diagrams/graphics/illustrations, print variations, an index, and a glossary....
ClassFlow
Class Flow: Reading Circle Graphs
[Free Registration/Login Required] Students are asked to figure out the size of the shaded portions of a circle graph. They then complete a chart showing the fraction, decimal, and percentage equivalents.
University of Texas
Inside Mathematics: Parking Cars [Pdf]
This task challenges a student to use their understanding of scale to read and interpret data in a bar graph.
Council for Economic Education
Econ Ed Link: The Economics of Homebuying
This lesson analyzes the costs and benefits of homeownership and asks the student to describe the factors that affect affordability, use cost-benefit analysis and knowledge of home-buying procedures to reduce the costs, analyze the...
ProProfs
Pro Profs Quiz Maker: Map Reading Awareness Quiz
This is a nine-question quiz about information on maps and parts of a map. The questions are timed, but not limited.
Other
La Rue Literacy Exercises: Reading a Map: Quiz 12
In this quiz, students are given sections of a map with locations like the school, post office, back, etc. They are asked questions about directions from one place to the other.
ReadWriteThink
Read Write Think: A Picture's Worth a Thousand Words: Image to Narrative
This lesson, which can be adapted to fit with any picture you choose, works for students of all levels.
Scholastic
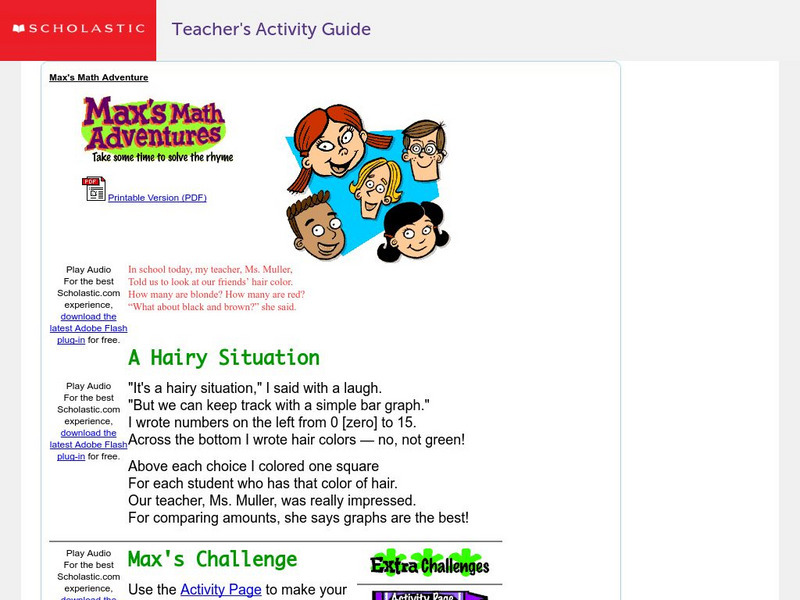
Scholastic: Max's Math Adventures: A Hairy Situation
Help Max make a bar graph to show the hair colors of his classmates. Teachers will appreciate the activities with bar graphs in the extra challenges. Use the teacher's guide to create a fun and engaging lesson.
Alabama Learning Exchange
Alex: Ice Cream Sundae Survey
Students quickly realize the importance of learning how to read and find information in charts, graphs, and tables compared to finding the same information written in a paragraph. This is a fun, high energy lesson!This lesson plan was...
Texas Education Agency
Texas Gateway: Synthesize Ideas in Informational/expository Text
[Accessible by TX Educators. Free Registration/Login Required] Learn how to synthesize and make logical connections between ideas within a text and across two or three texts representing similar or different genres and to support the...
Concord Consortium
Concord Consortium: Stem Resources: Describing Velocity
An interactive module where students record their ideas in response to questions, and read and manipulate graphs and charts while they learn about velocity-time graphs and position-time graphs.
TeachEngineering
Teach Engineering: Engineering for the Earth
Young students are introduced to the complex systems of the Earth through numerous lessons on its natural resources, processes, weather, climate and landforms. Key earth science topics include rocks, soils and minerals, water and natural...
English Zone
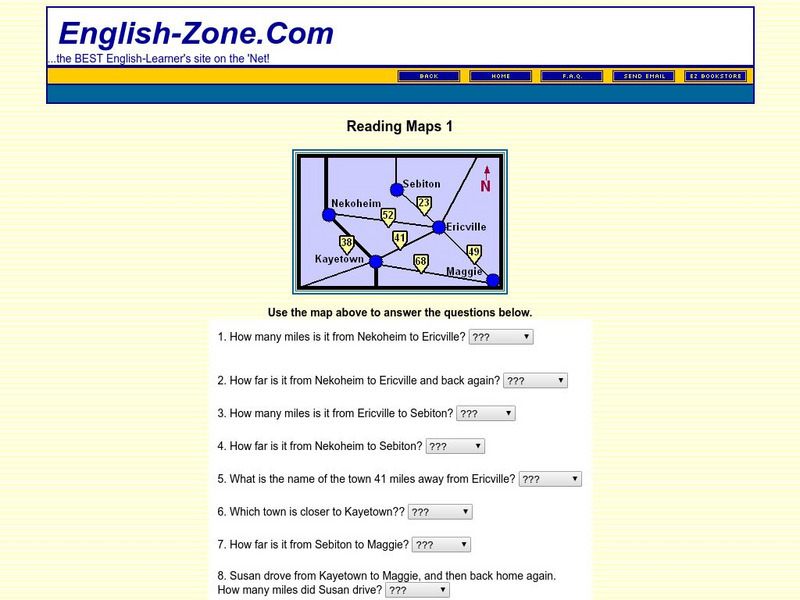
English Zone: Reading Maps 1
Using the map provided, students are to answer questions such as how far is it from one town to another.


