Hi, what do you want to do?
Curated OER
At Home on the Range
Eighth graders explore rangeland uses in Utah. In this Utah rangeland lesson, 8th graders read background information on the purposes of rangeland. Students work in groups to create their own ranges using peat. Students discover grazing...
Curated OER
Show Me!
Students analyze and interpret graphs. In this graphing lesson plan, students view a video and construct their own graphs (line, circle, bar) from given sets of data.
Curated OER
Using Non-Text Features
Second graders examine graphs and charts from their local newspaper. As a class, they discuss what the data means and how it relates to the article. In groups, they are shown two sets of graphs or charts and they practice explaining...
Curated OER
Looking through the Sands of Time: 80's Decade
Young scholars view the comic "Time sliders" from the Celebrate the Stamp Unit from the 1980's. They discuss what the comic magazine contains. Students listen to a speaker from the post office discuss how stamps are selected. They use...
Curated OER
Meatiest States: Graph Problem Solving
In this graph problem solving activity, learners analyze a graph that shows commercial red meat production in five states. Students answer 5 word problems using the data on the graph.
Curated OER
Graphing
Fifth graders create graphs based on climate in South Carolina. They read and interpret information in a chart and construct a graphy from the information in the chart. They create a spreadsheet using Excel and publish 2 graphs.
Curated OER
Thank You... Thomas Edison!
Learners investigate the life of Thomas Edison. They research how he made a difference. They understand that accurate data collection is important for math. They create a chart using spreadsheet data.
Curated OER
Data Analysis, Probability, and Discrete Math: Lesson 6
Eighth graders engage in a lesson that is concerned with the concepts surrounding the interpretation of information included in graphs for analysis of data for probability. They examine circle graphs and differentiate the values of...
Curated OER
Personal Budgeting Project
Students create an Excel spreadsheet of a personal budget by estimating their possible income and monthly expenses from a worksheet. They group together to create a family unit and use the personal budget sheets to plan a family budget.
Curated OER
Calories
Students explore calories. In this lesson about calories, students practice counting and recording calories. Students use a sample Calorie Calculation Chart to record how many calories consumed in one day. Students do an experiment on...
Curated OER
Chessboard Challenge
Second graders read "The King's Chessboard" by David Birch. The teacher reads the story aloud and pauses at several points for students to calculate the next number in a pattern of doubling.
Curated OER
Paying for Crime
High schoolers participate in activties examining ratios and proportions. They use graphs to interpret data showing the government's budget for prisons. They present what they have learned to the class.
Curated OER
Body Language
Students practice communication skills. In this body language lesson, students compare verbal and nonverbal communication as they analyze body language and learn how it conveys emotions.
Curated OER
How Do We Spend, Save, and Donate?: Penny Drive
Students explore the power of money. In this philanthropy lesson, students investigate how money is used in society. Students record data regarding money patterns on graphic organizers.
Curated OER
How much is Dirt Worth?
Students problem solve to understand the value of the Earth's soil. In this value of dirt lesson, students understand how much of Earth is made of dirt and how important to our survival it is.
Curated OER
Publishing Autobiographies 2
Eighth graders identify the 5th step of the writing process and apply the process to student autobiographies. While in the computer lab, they continue to type their autobiographies, and create covers for their autobiographies.
Curated OER
Garbage Pizza
Fourth graders explore the concept of waste management. In this recycling instructional activity, 4th graders identify materials that must be landfilled as well as items that may be recycled or reused.
Curated OER
"One Day in the Prairie" by Jean Craighead George
Students collect "prairie insects" for data collection and analysis.
Curated OER
Search for the Missing Pi
Third graders work in groups of two to three with measuring tapes, finding the circumference and diameter of teacher-selected circular items. They relate circumference and diameter measurements to find pi.
National Center for Ecological Analysis and Synthesis, University of California Santa Barbara
Ucsb / Pie Graphs (Piece of Cake)
This page gives an example and easy-to-understand description of a pie graph (circle graph.) Also provides an opportunity for students to test their abilities to read a pie graph.
Texas Education Agency
Texas Gateway: Analyze Graphical Sources: Practice 2 (English I Reading)
This lesson focuses on practice exercises to understand and interpret the data in a graphic representations including pie charts, bar graphs, and line graphs.
Primary Resources
Primary Resources: Line Graphs and Pie Charts
Here are a few resources to use with your students when teaching about line graphs or pie charts.
ClassFlow
Class Flow: Pie Charts Handling Data
[Free Registration/Login Required] Students read and interpret information presented in a pie chart and then determine percentages and ratios numerically and graphically.
American Museum of Natural History
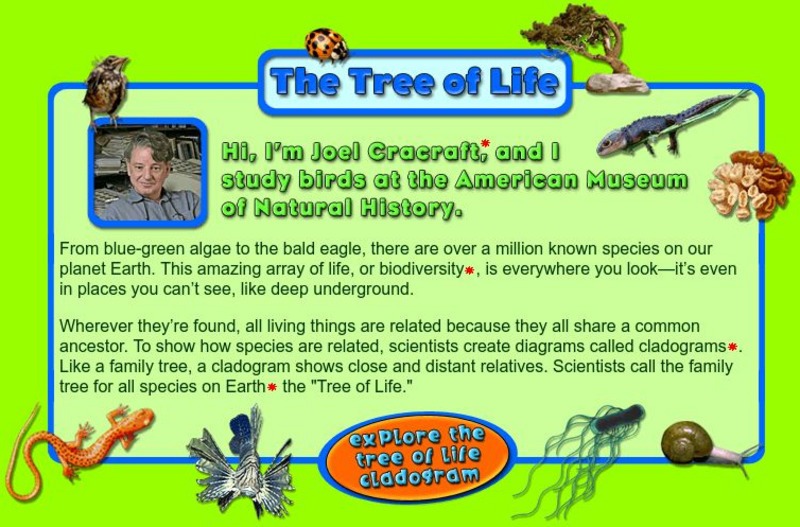
American Museum of Natural History: O Logy: The Tree of Life
Learn about the diversity of species on Earth by exploring a cladogram, a graph-like tree of life that illustrates relatedness among species. Includes instructions for reading cladograms and a pie chart that summarizes the percentages of...


