Noyce Foundation
Ducklings
The class gets their mean and median all in a row with an assessment task that uses a population of ducklings to work with data displays and measures of central tendency. Pupils create a frequency chart and calculate the mean and median....
Curated OER
Chances Are...
In this math worksheet, students perform 2 math investigations pertaining to probability--flipping pennies and rolling dice. Students record on the worksheet the results of each attempt, then graph the results. Note: The directions...
Curated OER
Fossils: The Eras of the Earth's History
Learners research the four geologic eras of Earth's history. In this extension on a fossils lesson, students research the different eras of Earth's history. Learners use AppleWorks to create a bar graph containing information of the four...
Curated OER
Nicotine addiction and youths
Students read CNNfyi article: "Nicotine addiction can begin in days, study says," and have class discussion about the effects of nicotine on the human body.
Alabama Learning Exchange
The Water Cycle
Learners identify the stages of the water cycle. They listen to the book "Magic School Bus: Wet All Over," examine the Build Your Own Water Cycle website, predict and measure the amount of water in a jar for a week, and read a short play...
iCivics
The Fourth Branch: You!
Take time to remind your young learners of the valuable understanding that each branch of the United States government is really composed of other citizens. The reading material and worksheets of this resource cover the importance of...
Curated OER
Baseball Math
Students collect data on baseball plays. In this statistics lesson, students graph their data and make predictions based on their observation. They calculate what the probability is that a favorable outcome would happen.
Curated OER
Education for Global Peace
Fifth graders construct data graphs based upon sets of data. In this graphing lesson, 5th graders read the text If the World Were a Village and discuss how types of graphs accurately represent a large population. Students construct their...
Curated OER
Snow Cover By Latitude
Pupils create graphs comparing the amount of snow cover along selected latitudes using data sets from a NASA website. They create a spreadsheet and a bar graph on the computer, and analyze the data.
Curated OER
A is for Apple
Learners participate in a variety of activities to learn about apples. Students graph apples, learn about apple uses, taste apples, and observe what happens when apples are dipped in lemon juice.
Curated OER
Number of Cell phones in Use Per Household
In this cell phones worksheet, students study a bar graph of the number of cell phones usage in households. Students answer 5 questions about the graph.
Curated OER
Enhancing Writing Through Technology
Students participate in a class survey of their favorite activity to do in the snow and organize the results in a graph. They write a paragraph about the graph using language from a class-developed word web and include both an opening...
Curated OER
Math Made Easy
Students evaluate word problems. In this problem solving lesson, students are presented with word problems requiring graphing skills and students work independently to solve.
Curated OER
Dental Detectives
First graders explore the theme of dental health and hygeine. They make tooth loss predictions, count lost teeth, and graph tooth loss. In addition, they listen to dental health stories, read online stories, create spreadsheets, and play...
Law for Kids
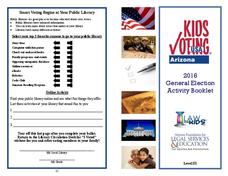
General Election Activity Booklet
It's never too early to practice smart voting! Gain practice voting in a general election using a booklet compiled of an assortment of activities including a word search, maze, graphing, and more!
Curated OER
The Guise of a Graph Gumshoe
Eighth graders practice constructing bar, circle, and box-and-whisker graphs. They practice reading and interpreting data displays and explore how different displays of data can lead to different interpretations.
Curated OER
Delicious Graphing
Fourth graders sort trail mix by type and use that information to create different types of graphs for comparing.
Curated OER
Graphing
Fifth graders create graphs based on climate in South Carolina. They read and interpret information in a chart and construct a graphy from the information in the chart. They create a spreadsheet using Excel and publish 2 graphs.
Curated OER
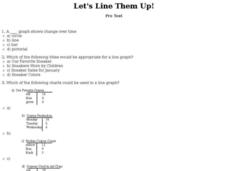
Let's Line Them Up!
In this line graph worksheet, students read through the problems about graphing and line graphs. Students select the best answer to solve the 10 online questions.
Curated OER
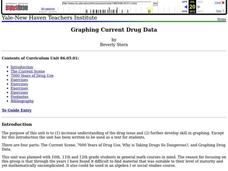
Graphing Current Drug Data
Young scholars increase understanding of the drug issue and further develop skill in graphing.
Curated OER
Introduction to Graphical Representation of Data Sets in Connection to Cellular Growth
Students practice graphing relationships between variables by studying topics such as exponential growth and decay. They conduct a series of numerical experiments using a computer model and a variety of physical experiments using mold,...
Curated OER
My Peanut Butter is Better Than Yours!
Learners explore the concept of statistical data. In this statistical data lesson, students read an article about the dangers of peanut butter to those who are allergic. Learners perform a taste test of two different brands of peanut...
Curated OER
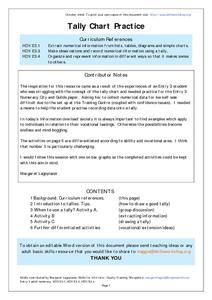
Tally Chart Practice
In this tally chart instructional activity, students will read about tally charts and their uses. Students will make a list of when and why they could make a tally chart. Next students will complete a tally chart and write statements...
Curated OER
Rolling with Links
First graders explore geometry by completing a worksheet in class. In this non-standard measurement unit lesson, 1st graders discuss different techniques for measuring items without the use of a ruler. Students read several short stories...


