Curated OER
Stick Out Your Tongue
Students explore their sense of taste and recognize good foods to eat. In this tasting lesson, students recognize that their tongue has taste buds for different types of tastes. Students create a bar graph showing their favorite taste (...
Curated OER
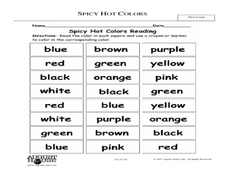
Spicy, Hot Colors
Students demonstrate an understanding of colors. In this visual arts lesson, students read the text Hot, Spicy Colors and name their favorite colors. Students complete a bar graph to show the data. Students discuss how each color can...
Curated OER
The North (Wall) Star
Young scholars engage in a lesson which shows them that celestial navigation is the art and science of finding one's geographic position by means of astronomical observations, particularly by measuring altitudes of celestial objects -...
Curated OER
Biodiversity
Students investigate the diversity of temperate forests and tropical rainforests. They catch and observe local insects, sort leaves and insects on a chart, listen to the book "A Walk in the Rainforest," and create a class bar graph that...
Curated OER
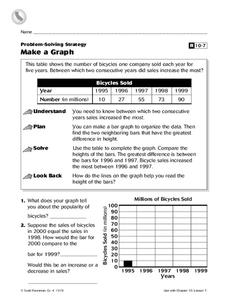
Make a Graph
In this graphs worksheet, 4th graders, after studying and analyzing a table on bicycles sold within several years, answer 2 short answer questions relating to the table.
Curated OER
Water: From Neglect to Respect
The goal of this collection of lessons is to make middle schoolers more aware of the ways in which they are dependent upon water to maintain their standard of living. Learners compare water use in Lesotho to water use in the United...
Curated OER
WebQuest: Thrills and Spills- Pick Your Park!
Students participate in a WebQuest in which they must determine which amusement park is the "median priced" park. Students visit park websites to accumulate prices for parking, activities, restaurants, and gift shops.
Curated OER
Skittle Graphing (Lesson Plan)
Students discuss the uses of graphs. They use color candies to count and sort before designing graphs. They label the graph papers with appropriate titles and candy colors. They complete the graph bars, and discuss the results with a...
Curated OER
Weather Graphs
First graders use their knowledge of weather symbols to organize and construct a graph of the daily weather for one month. Each student have a chance to give the daily weather report using Sammy's Science House Computer Software.
Curated OER
ESTIMATION
Students practice estimating and counting and using a ruler to measure distance.
Curated OER
Relative Dating-Telling Time Using Fossils
Students explore how to read fossil range charts. They develop an knowledge of the strengths and weaknesses of the fossil record. Students become familiar with the concepts index fossil and fossil range. Students use bar graphs to...
Curated OER
Viruses: Tiny But Deadly
In this viruses worksheet, students read given information about the effect of viruses on people throughout history. Students create a bar graph comparing the viruses and answer seven questions based on the information they have learned.
Curated OER
Chemistry Review
In this chemistry review worksheet, learners read about atoms and the periodic table and they complete a chart using the periodic table to find the atomic number, atomic mass and group of given elements. Students answer 5 questions about...
Curated OER
"Favorite Fairy Tale Characters"
Third graders enter the results of their survey on a spreadsheet. They construct a bar graph showing the results.
Curated OER
Living in the Desert
Conduct an investigation on the plants used by the Hohokam tribe. To survive in the harsh desert environment the Hohokam used many natural resources. Learners read, research, map, and graph multiple aspects of Hohokam plant use as a...
Curated OER
Book: Latinos Today: Facts and Figures
Students, after reading Chapter 1 in the book, "Latinos Today: Facts and Figures," identify and characterize the four main ethnic/racial groups in America. They calculate and design a bar graph showing their populations by their...
Curated OER
Language Arts: Lewin Project
Fourth graders read and respond to the poem, "When I Am Angry." They complete surveys by analyzing the most common feeling and draw a bar graph of their behavior, using different colors to identify the duration of various feelings. ...
Curated OER
Halloween Candy/ Sugar Content
Fourth graders examine the amount of sugar contained in Halloween candy by looking at nutritional labels from candy bars. They figure out ways to encourage people to reduce the amount of sugar they eat at this holiday. They look at the...
Curated OER
Testing Battery Combinations
Fourth graders examine the required combinations of plates and predict which combination will generate the most and least current and voltage. They use an ammeter and experiment with combinations of their own testing and record each...
Curated OER
Measurement Review
Learners measure the distance between two points. In this measurements lesson, students read books about birds that migrate and measure the distances that each bird flies when it migrates. Learners discuss the information as...
Curated OER
Force and Gliders
Young scholars explore physics by creating data graphs in class. In this flight properties lesson, students read the book Flying Machine and identify the force, resistance and construction necessary to keep a glider in the air. Young...
Curated OER
A Birthday Basket for Tia
Students practice reading and math skills using technology. In this main idea instructional activity, students retell the important events of A Birthday for Tia in sequence using Kid Pix. Students create a bar graph...
Curated OER
Yummy Math
Young mathematicians use bags of Skittles to help them gain practice in graphing and organizing data. They work in pairs, and after they have counted and organized their Skittles, they access a computer program which allows them to print...
Curated OER
Shirts Full of Buttons
Students match sets of buttons to complete subtraction problems. In this subtraction lesson plan, students answer the questions "how many more/less" and make bar graphs by counting up the buttons they are wearing.


