Illustrative Mathematics
Favorite Ice Cream Flavor
What better way to engage children in a math lesson than by talking about ice cream? Using a pocket chart or piece of chart paper, the class works together creating a bar graph of the their favorite ice cream flavors. Learners then work...
Texas Education Agency (TEA)
Gaining Understanding and Information from Introductory Material, Headings, and Other Division Markers in Texts (English III Reading)
All teachers are teachers of reading! The 13-part interactive series ends with a lesson that teaches learners (and their instructors) how to approach reading their textbooks. After learning about several strategies, users test their...
Illustrative Mathematics
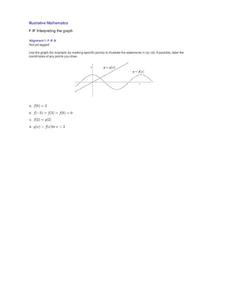
Interpreting the graph
The purpose of this exercise is to give practice in reading information about a function from its graph. Learners are given graphs of two functions on the same axes. The task is to locate and label various key points on the graph that...
Illustrative Mathematics
Warming and Cooling
Is it too hot to go hiking? This task asks learners to refer to a graph that shows temperature as a function of time and answer five questions about the scenario depicted by the graph. The exercise could be used for instruction to help...
It's About Time
Volcanic Hazards: Airborne Debris
Pupils interpret maps and graph data related to volcanic ash. Then they analyze the importance of wind speed and the dangers of the ash to both life, air temperature, and technology.
Shmoop
ELA.CCSS.ELA-Literacy.RI.11-12.7
Comparing information found in images, charts, and graphs with that found in written text can be a challenge for even senior high scholars. Provide learners with an opportunity to practice this skill with an exercise that asks them to...
Illustrative Mathematics
Downhill
A car traveling down a steep hill is the model for this resource. The confusion comes when the elevation, E, is given in terms of distance, d. The distance, d, is the horizontal distance from E. Therefore, the equation, E = 7500 – 250d,...
Illustrative Mathematics
Robot Races
Analyze data on a graph to answer three questions after a robot race. Learners practice comparing ratios and reading points on a graph. Answers may vary on the last question based on accuracy of graphing. Use the lesson along with...
Illustrative Mathematics
Invertible or Not?
What determines whether a function has an inverse? Learners investigate that criteria when they examine values in a partially completed input-output table for two different functions. The task is to complete the table so that one of the...
Illustrative Mathematics
Influenza epidemic
This activity presents a real-world problem about an epidemic of influenza spreading through a city. Learners refer to a graph that shows the number of individuals infected in relation to the number of weeks that have elapsed since...
5280 Math
Go with the Flow
Round and round they go ... where they stop, only scholars will know. By writing systems of equations, classes determine the number of cars a roundabout can handle given specific constraints. Systems use up to six variables and become...
National Academy of Sciences
Lights at Night Webquest
Help learners find ways to become more efficient energy consumers. To start, individuals research how different countries address energy efficiency and then analyze their own carbon footprint. They use their research to identify ways to...
University of Cambridge
University of Cambridge: Nrich: The Pet Graph
On this one-page website, sharpen your logic and graph reading skills by figuring out which pet goes with each bar on the graph. The solution is available to double check your own solution.
Texas Education Agency
Texas Gateway: Analyze Graphical Sources: Practice 2 (English I Reading)
You will look at each of these types of graphs: bar graph, line graph, pie charts, as you work your way through the lesson.
Read Works
Read Works:north America:comparing Data From Different Countries Around the World
[Free Registration/Login Required] A chart with land and population data from Canada, the United States of America, the United Kingdom, and Japan. A question sheet is available to help students build skills in reading comprehension.
Rice University
Rice University: Cynthia Lanius: Interpreting Graphs: The Hot Tub
The graph of the water level of a hot tub is presented and students are asked to tell the story of how the water level changes. Explanations of slope and functions accompany the problem.
National Council of Teachers of Mathematics
The Math Forum: Urban Systemic Initiative/oceans of Data
This site includes questions related to reading and understanding graphs. There are links on this site to lesson plans, benchmarks, and other webpages all of which mostly center about probability and statistics.
English Zone
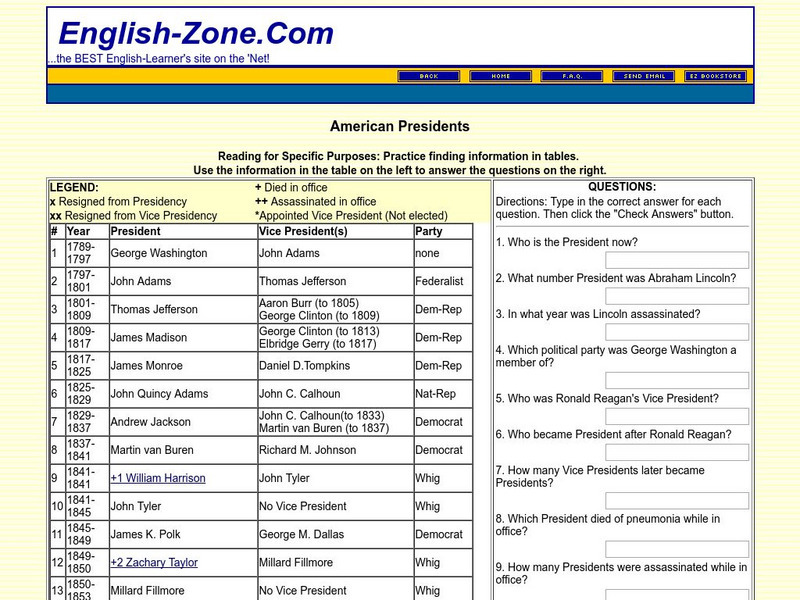
English Zone: American Presidents: Reading for a Specific Purpose
In this activity, information about American presidents is provided in chart format on the left and asks students to use the chart to answer the questions on the right. Note: the last president listed is George W. Bush. Java is required.
Texas Instruments
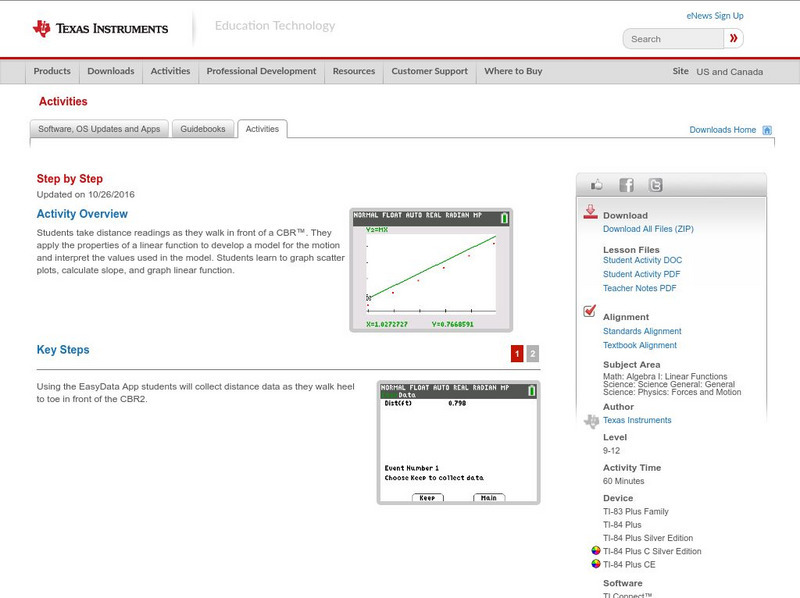
Texas Instruments: Step by Step
In this activity, students take distance readings as they walk in front of a CBR. They apply the properties of a linear function to develop a model for the motion and interpret the values used in the model. Students learn to graph...


