Wisconsin Online Resource Center
Oversized Inch
Each member of the class creates their own paper ruler. Using their ruler, kids walk around the room measuring the objects you've specified. Discuss how items should be measured to the 16th of an inch, the smallest unit on their ruler....
Blake Education
Harry Potter and the Philosopher’s Stone
The motto for Hogwarts School of Witchcraft and Wizardry warns that one should never tickle a sleeping dragon, but learners will definitely be tickled by the activities in a packet of materials designed to accompany a reading of the...
Polar Trec
Global Snow Cover Changes
Snow is actually translucent, reflecting light off its surface which creates its white appearance. Pairs or individuals access the given website and answer questions about snow cover. They analyze graphs and charts, examine data, and...
Curated OER
Virtual Field Trip
This hands-on resource has future trip planners analyze graphs of mileage, gasoline costs, and travel time on different routes. While this was originally designed for a problem-solving exercise using a Michigan map, it could be used as a...
Shmoop
ELA.CCSS.ELA-Literacy.RI.11-12.7
Comparing information found in images, charts, and graphs with that found in written text can be a challenge for even senior high scholars. Provide learners with an opportunity to practice this skill with an exercise that asks them to...
Curated OER
FUN WITH MAPS
Fifth graders learn map skills by showing the routes they travel from home to school and using that data to practice map reading and interpreting geographical information.
Curated OER
Cindy and Linda Selling Lemonade
For this graphing worksheet, students read a graph, complete a chart about the information, and answer questions. There are fifteen questions in all.
Curated OER
Effects of chemical use in Agriculture
Students research environmental data to create a bar graph. In this agricultural ecology instructional activity, students research the pros and cons of chemical use in farming. Students debate on passing a law to reduce chemical use.
Curated OER
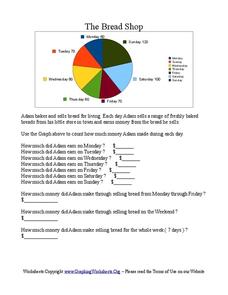
The Bread Shop
In this pie chart activity, students use the pie chart graph to count the money Adam made in the Bread Shop. Students complete 10 questions.
Curated OER
National Longitudinal Survey of Children and Youth (NLSCY)
Students review data analysis techniques. For this statistics lesson, students access statistical software regarding the National Longitudinal Survey of Children and Youth. Students read and interpret the data as they complete the...
Curated OER
Mathematics and Ecology: Through the Window Garden
Student discover some of the ideas and concepts that make up the topic of Ecology. They read and interpret graphs to assimilate the information that is displayed. They discover the rate of increase of Carbon dioxide in the atmosphere...
Curated OER
Graphing With RXTE
Students use data from the Rossi X-ray Tiiming Explorer (RXTE) satellite to analyze and graph.
Curated OER
The Stock Market Game
Students participate in a variety of stock market games within their classmates. They study the concepts of stocks and investments as well as the criteria for selecting of stocks. Each student is shown how to keep track of the progress...
Curated OER
Temperature
Students explore the concept of temperature. In this temperature instructional activity, students read thermometers in degrees Celsius. Students discuss the temperature of the seasons and what clothing they might wear given a certain...
Curated OER
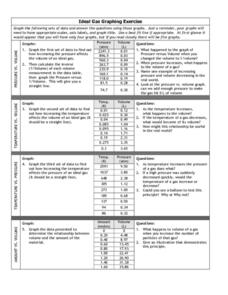
Graphing Exercise of Ideal Gas Data
For this graphing of Ideal Gas Data worksheet, students use the given data to draw 4 graphs of the given data. They are given the pressure and volume to draw and interpret the graphs.
New York City Department of Education
Grade 5 Literacy in Science: Ecosytems
How do humans affect ecosystems? Learners read two articles and interpret a graph to develop essays on the human impact on ecosystems. They read about human impact on tigers and manatees as a basis for their overarching papers.
Curated OER
Santa's Route
For this route worksheet, learners observe a chart of Santa's route and answer word problems about the distance he travels between cities. They complete six problems.
Utah Education Network (UEN)
Utah Open Textbook: Physics
Textbooks come in all shapes, sizes, and media these days. An electronic textbook resource offers Physics materials for an entire course. The text offers an explanation of physics topics as well as examples of calculations and reading...
Curated OER
Graphing
Fifth graders create graphs based on climate in South Carolina. They read and interpret information in a chart and construct a graphy from the information in the chart. They create a spreadsheet using Excel and publish 2 graphs.
Curated OER
Graphs Galore
Fourth graders conduct surveys to collect data. They analyze and interpret the data, then determine which type of graph is appropriate for the data. Students use the data to make predictions, discover patterns and draw conclusions...
Curated OER
Using Charts and Graphs to Study East Asia's Modern Economy
Students examine East Asia's modern economy. In groups, classmates use the internet to compare the resources, products, and economy of specified countries. After collecting the data, pupils create charts, tables and graphs. They...
Curated OER
Our Favorites
Students participate in and conduct a survey to determine various class favorites. They collect, organize and display their data, interpret the results, and complete a packet of worksheets to display the information.
Curated OER
What's Your Line?
Fifth graders collect temperature readings over a period of time, enter the information into a spreadsheet and choose the appropriate graph to display the results.
Curated OER
Loving Literature
First graders, after having "Are You My Mother?" by P.D. Eastman read to them, participate in group discussions or independentally work to analyze a spreadsheet to identify essential elements in the story and graph their data. In...


