Curated OER
What Color is Your Air Today?
Students investigate air quality. They analyze Air Quality Index data tables, interpret the graphs, complete a worksheet, and discuss trends in air quality.
Curated OER
Trouble in the Troposphere
Students Use data sets from MY NASA DATA to produce graphs comparing monthly and yearly ozone averages of several U.S. cities. They analyze and evaluate the data and predict trends based on the data. In addition, they discuss and...
Alabama Learning Exchange
The Very Hungry Class
Students listen to a read aloud of Eric Carle's, The Very Hungry Caterpillar, as an introduction to their study of the metamorphosis of a butterfly. They participate in a number of cross-curricular activities in this unit of lessons.
Curated OER
Wonderful Watermelons
First graders explore watermelons and collect and sort their seeds. In this watermelons lesson plan, 1st graders read the story Down By The Bay and then weigh, measure, collect seeds, sort, and eat their watermelon.
Curated OER
Cold Enough?
Students read and record temperatures and display the data. They represent the temperatures on an appropriate graph and explain completely what was done and why it was done. Students display the data showing differences in the daily...
Curated OER
Could You Repeat That?
Pupils participate in an oral story telling activity designed to show how story embellishments occur. They read "Beowulf" and identify incongruities that suggest additions and embellishments over the years.
Curated OER
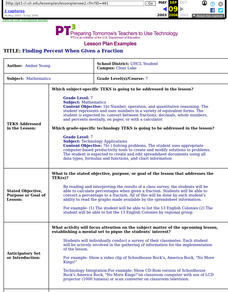
Finding Percent When Given A Fraction
Seventh graders calculate percentages when given a fraction. They convert a percentage to a fraction. All of this be done by each student's ability to read the graphs made available by the spreadsheet information.
Curated OER
I'm a Weather Watcher Watching plants grow by......my,my,my
Young scholars investigate how weather affects how plants grow. They collect data on weather and plant growth for a week and display the data on a graph. For a culminating experience they design a movie using software that shows plant...
Curated OER
Trouble in the Troposphere
Students create graphs using NASA data, compare ozone levels of several U.S. cities, analyze and evaluate the data and predict trends based on the data, and discuss and describe how human activities have modified Earth's air quality.
Curated OER
Linkages Between Surface Temperature And Tropospheric Ozone
Students collect and interpret data to make predictions about the levels of ozone in the atmosphere. Using the internet to collect data students use their collected data to create a line graph for analysis. Students make mathematical...
Curated OER
The 100 Meter Race Problem
In this meter activity problem, students read a word problem and interpret a graph. They use the derived information to determine time and distance. This one-page activity contains 1 multi-step problem. Answers are...
Curated OER
What's Going to Happen at Any Given Barometer Reading?
Fourth graders brainstorm a list of words associated with weather. In groups, they sort the words into categories and observe the weather in their area for a month. To end the lesson, they compare the barometer measurements for a...
Curated OER
Fine Arts in School
In this math chart worksheet, students use the chart to answer the questions. The information on the chart is about students who participate in fine arts.
Curated OER
Coral Reef Center Math
In this math activity, students find the solutions to the math problems with the use of the graphs using the theme of coral reefs.
Curated OER
Using Non-Text Features
Second graders examine graphs and charts from their local newspaper. As a class, they discuss what the data means and how it relates to the article. In groups, they are shown two sets of graphs or charts and they practice explaining...
Curated OER
Finding an Earthquake's Epicenter
Students examine the process used to identify the epicenter of an earthquake. They identify the Richter scale and interpret a seismograph reading. They also view photographs of the aftermath of earthquakes.
Curated OER
Saving Money Through Mathematics
Third graders discuss light sources and collect data about energy sources. They compare data and create a multiple line graph showing energy used by light sources for each student in the group. They present their graphs and write a...
Curated OER
COLONIAL FLYERS/TRAVEL BROCHURES TO THE COLONIES
High schoolers investigate concepts of history and geography in this lesson. They create travel brochures for travelers who are crossing the Atlantic Ocean to populate the colonies of early America. The brochure has topographical...
Curated OER
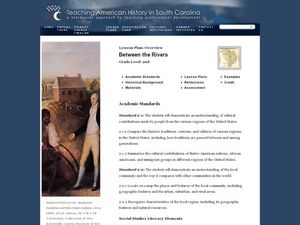
Between the Rivers
Second graders compare and contrast historical American cultures. In this American history lesson, 2nd graders participate in reading, writing, oral, and hands on activities. Students discuss the similarities and differences...
Curated OER
Real World Systems of Linear Equations
Students solve systems of equations with fluency. For this algebra lesson, students graph, use elimination and substitution to solve systems of equations. They identify the point of intersection using algebra.
Curated OER
Integrated Social Studies and Math Lesson
Fourth graders study the American Civil War. They read and analyze information regarding the casualties of the Civil War, fucusing on Indiana soldiers. They graph the information and then write in their reflective journals responding...
Curated OER
Jelly Belly: What a Wonderful "Bean"!
Students explore how jelly beans are produced. They discuss the origins of the jelly bean and view a video about how jelly beans are prepared, tested, shaped, finished, and shipped and estimate the amount of jelly beans in a jar and sort...
Curated OER
The Cultural Geography of Australia, Oceania, and Antarctica
Students use information from the Australian Department of Immigration and Multicultural Affairs Web site to explore multiculturalism and immigration in Australia. They create graphs and charts from immigration data.
Curated OER
Chicken Pox Math
Second graders are read a story about a boy with chicken pox. As a class, they discuss what to do when you have a contagious disease and identify who in the class has had chicken pox. Using this information, they create a graph and use...


