Curated OER
Is there Treasure in Trash?
More people, more garbage! Young environmentalists graph population growth against the amount of garbage generated per year and find a linear model that best fits the data. This is an older resource that could benefit from more recent...
Alabama Learning Exchange
How Big Can a Bee Be?
Mathematicians analyze the relationships between surface area and volume. They conduct Internet research, conduct various experiments, record the data in a spreadsheet, and graph the results and compare the rate of increase of surface...
Virginia Department of Education
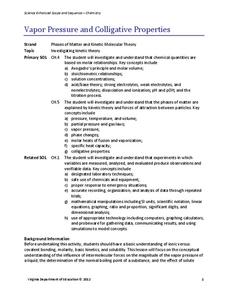
Vapor Pressure and Colligative Properties
Hate to vacuum, but enjoy using a vacuum pump? Explore a instructional activity that starts with a demonstration of boiling water at various temperatures by using a vacuum pump. Then scholars design their own experiments to measure vapor...
Curated OER
Flow Rates of Faucets and Rivers
Students work together to discover the flow rates of faucets and rivers. They relate their results to engineering and applied science concepts. They make predictions on the flow rate of a nearby river in their local community.
Cornell University
Math Is Malleable?
Learn about polymers while playing with shrinky dinks. Young scholars create a shrinky dink design, bake it, and then record the area, volume, and thickness over time. They model the data using a graph and highlight the key features of...
LABScI
Population Dynamics: The Predator-Prey Lab
Wolves eat better when the bunny population increases, but how long does that last? A series of 12 biology lessons uses the sixth installment to explore the predator-prey relationship between bunny and wolf populations. Young scientists...
Curated OER
Walking Home II
Students explore the relationship between distance and time. They analyze a situation involving distance traveled in a given period of time, represent the situation graphically and algebraically, and discuss the concept of slope as a...
Curated OER
Water in the Texas Coastal Basins
Students, after researching a Texas coastal basin, map and graph the information they collect and then translate it into a short report to be presented to their classmates. They brainstorm unique ways to maintain Texas estuaries as well...
Curated OER
Putting Your Money to Work
Students create a collect data on expenses. In this algebra lesson plan, students create a spreadsheet to solve scientific equations. They incorporate math, science and technology in this lesson plan.
Curated OER
Saving Money Through Mathematics
Third graders discuss light sources and collect data about energy sources. They compare data and create a multiple line graph showing energy used by light sources for each student in the group. They present their graphs and write a...
Curated OER
How Texas is Planning To Manage Its Water
Students research water management strategies in Texas. They analyze projected demand for water in the year 2050, interpret graphs and tables and then discuss the data as part of a written report. They research and map the locations of...
Curated OER
Ohm's Law
In this Ohm's Law learning exercise, students answer 16 questions about electricity, electric current, voltage and electricity and they mathematically analyze a circuit they design and construct.
Curated OER
Water: On the Surface and in the Ground
Pupils explore the differences between surface water and ground water. They collect data using maps and graphs and investigate a Texas river basin and a nearby aquifer. They complete a written report including maps and data regarding the...
Curated OER
Water-Is There Going to be Enough?
Students research the availability, usage and demand for water in the local area historically and use projections of the availability, usage and demand for water up to the year 2050. They gather data and present the information in...
Curated OER
Bubble Gum Chemistry
Students explore the concept of graphing data. In this graphing data instructional activity, students determine the percentage of sugar in bubble gum. Students graph type of gum vs. sugar percentage. Students create a table of their data.
Illustrative Mathematics
Illustrative Mathematics: F Le in the Billions and Linear Modeling
In this task, learners are shown a table of world population data and asked to explore whether linear functions would be appropriate to model relationships within the data. Aligns with F-LE.A.1.b.


