Curated OER
Height versus Shoe Size
Students find a correlation between a person's height and his/her shoe size. They have access to entering data into lists on a graphing calculator and can complete scatter plots. Students read and interpret a scatter plot and use the...
Curated OER
WebQuest: Thrills and Spills- Pick Your Park!
Students participate in a WebQuest in which they must determine which amusement park is the "median priced" park. Students visit park websites to accumulate prices for parking, activities, restaurants, and gift shops.
Curated OER
Beary O'Mometer Learns About Careers In Meteorology
Students explore the field of meteorology. In this meteorology lesson, students explore weather-related careers as they research the field of study as well as various weather concepts. Students interview meteorologists, write business...
Curated OER
Make a Frequency Table and a Histogram for a Given Set of Data
In this data recording and data organization worksheet, students create one frequency table and one histogram for a given list of data. Explanations and examples for frequency tables and histograms are given.
Alabama Learning Exchange
I Know What You Did Last Summer: A Data Graphing Project
Young scholars participate in graphing data. In this graphing data lesson, students make a stem and leaf plot of their summer activities. Young scholars create numerous graphs on poster boards. Students discuss the...
Curated OER
Exploring Data Sets and Statistics in Baseball
Students explore the concept data sets. In this data sets lesson, students find the 5 number summaries for salaries of teachers and compare them with 5 number summaries of professional baseball players. Students use box and...
Curated OER
How Oceans Affect Climate
Young scholars draw conclusions about how the ocean affects temperature. In this weather lesson plan, students use the Internet to gather data to help them come to a conclusion about how the climate in a certain region is directly...
Curated OER
Statistics with State Names
Students analyze the number of times each letter in the alphabet is used in the names of the states. In this statistics lesson, students create a stem and leaf plot, box and whisker plot and a histogram to analyze their data.
Curated OER
Recognize, create and Record Simple Repeating Patterns
Students analyze, create, and record repeating patterns. In this geometry instructional activity, students create shapes using patterns and keep track of the different shapes. They incorporate transformation and reflections into their...
Curated OER
Water Cycle Bag
Students enclose water in an airtight bag and leave it in a warm area to view the water cycle. In this water cycle lesson plan, students observe evaporation, condensation, and precipitation. They then discuss what they learned about the...
Curated OER
Convection and Wind
Students use water, beakers, hot plates, paper dots, and goggles to participate in a hands on activity where they see how a convection current creates wind. In this convection current lesson plan, students participate in a hands on...
Curated OER
Looking for More Clues
Fifth graders explore how to collect data and display it on a bar and circle graph.
Curated OER
The Brain Eater
Students view a video clip about Mad Cow Disease. They identify the challenges of health professionals in dealing with the disease. They work together to complete a Public Health Task Force worksheet. They make recommendations on how...
Curated OER
Exquisite Excursions
Young scholars locate 6 cities, one on each of the 6 major continents. They find distance for each leg of their journey, convert to percents, use a time zone map, and convert to foreign currencies.
Curated OER
Art Exploration-A Global Approach
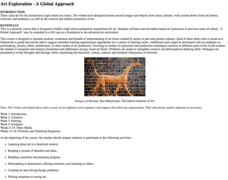
A high school unit focuses on a discipline-based study of artworks from many times, places, and cultures. Addressing historical works of art as well as modern techniques, the unit illustrates how a traditional organizational...
Curated OER
Snack Attack
Students design charts, tables, graphs, and pictographs to analyse the types of snacks in a bag.
Curated OER
Great Graphing
Students collect data, use a computer spreadsheet program to create various graphs, and compare the graphs. They state the findings of each graph in writing and decide which graph type best represents the data.
Curated OER
Designing Detectives
Third graders explore the idea of formulating a hypothesis and designing an experiment to test the hypothesis.
Curated OER
HEART THROBS
Students predict what might happen to their pulse rates after physical exertion and then make conclusions about the effects of physical activity on pulse rates.
Curated OER
FLIGHT FAIR
Young scholars conduct their personal investigations into paper airplane flight. Cooperative teams are formed, with students choosing the paper airplane design that they are most interested in building.
Curated OER
Cars on the Curve
Second graders, using two dice, participate in a car race game called Cars on the Curve. They predict which car wins the game and records it in their Data Diary.
Curated OER
Looking at Life through the Creation of Personal Metaphors
Students focus on the creation of personal metaphors, which are first illustrated in pictures and caricatures and then extended to descriptive/analytical paragraphs. They teach the lesson to others using their own personal metaphors as...
Curated OER
Paying for Crime
Students participate in activties examining ratios and proportions. They use graphs to interpret data showing the government's budget for prisons. They present what they have learned to the class.
Curated OER
Virus and Bacteriophage
Students examine the differences between a virus and a bacteriophage. They explore various websites, identify the parts of a virus and a bacteriophage, and construct a model of a virus or bacteriophage.
Other popular searches
- Mean Median Mode Range
- Mean, Median, Mode Range
- Mean, Median, Mode, Range
- Median Mode Range
- Mean Median Mode and Range
- Mean, Median, Mode, and Range
- Mode and Range
- Median Mode and Range
- Mean, Median, Mode and Range
- Median, Mode, Range


