EngageNY
Describing Variability Using the Interquartile Range (IQR)
The 13th lesson in a unit of 22 introduces the concept of the interquartile range (IQR). Class members learn to determine the interquartile range, interpret within the context of the data, and finish by finding the IQR using an...
Curated OER
Range, Mode, and Median
Fifth and sixth graders sort data from least to greatest and mark an X on the line plot to show how many of each number. Then they determine the range, mode, and median for the problem.
Curated OER
Domain and Range: Equation
In this algebra worksheet, students state the domain and range of various functions and equations. There are five questions and some are multiple choice questions.
Curated OER
Range, Cluster, Gap and Outliers
There are a number of activities here where learners collect and record data, as well as, activities where the likelihood of an event happening is calculated given the experimental probability. Young statisticians organize information...
EngageNY
Measuring Variability for Skewed Distributions (Interquartile Range)
Should the standard deviation be used for all distributions? Pupils know that the median is a better description of the center for skewed distributions; therefore, they will need a variability measure about the median for those...
Mathematics Assessment Project
Mean, Median, Mode, and Range
What a find! Here is a lesson, designed to meet sixth grade math Common Core standards, that focuses on the calculation of different measures of center for the scores from a penalty shoot-out competition. An independent...
Curated OER
Worksheet 31 - Doman & Range
In this function worksheet, students determine the domain and range of given functions. They use trigonometric ratios to determine if a statement is true or false. Students differentiate equations. In this one-page worksheet, students...
Curated OER
Twenty-One Domain and Range Problems
In this domain and range worksheet, students identify the domain and/or range for twenty-one free-response and multiple choice problems. The functions include trigonometric functions. The solutions are provided.
Curated OER
Maps and Modes, Finding a Mean Home on the Range
Fifth graders investigate data from maps to solve problems. In this data instructional activity, 5th graders study maps and collect data from each map. Students present their data in a variety of ways and calculate the mode, mean,...
Curated OER
Who's Range is it?
Students investigate the habits of panthers by analyzing radio transmitted data. In this animal life lesson, students utilize computers to view the range of different statistics dealing with Florida panthers. Students...
Virginia Department of Education
Functions: Domain, Range, End Behavior, Increasing or Decreasing
Examine key features of various functions through exploration. A comprehensive lesson plan has learners describe the domain, range, end behavior and increasing/decreasing intervals of various functions. Function types include linear,...
Willow Tree
Extremes, Range, and Quartiles
The middle of the data is important, but what about the rest of it? The lesson shows learners the importance of the range, quartiles, and extreme values. Pupils practice finding each of these values from given data sets.
Illustrative Mathematics
Oakland Coliseum
Help algebra learners relate a real-life function that happens at the Oakland Coliseum every time the Raiders play. The resource states that the revenue of the Oakland Raiders home games is a function of the number of seats sold and the...
Curated OER
Regents Exam Questions: Domain and Range 1
In this domain and range worksheet, students examine functions and identify the range of a function. They find the maximum and minimum value of a function. This two-page worksheet contains 7 multiple-choice problems. ...
Curated OER
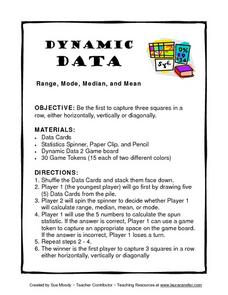
Dynamic Data Range, Mode, Median, and Mean
In this lesson, Dynamic Data Range, Mode, Median, and Mean, students play a game while figuring range, mode, median, and mean. Students spin for their task, figure the mode, mean, median or range of a row of numbers and gain a space on...
Curated OER
Range, Mean, Median, and Mode
Eighth graders find the range, median, mean, and mode of a data set. In this finding the range, median, mean, and mode of a data set lesson, 8th graders collect data about the high and low temperature for 10 different cities. ...
Curated OER
Finding Domain and Range
In this domain and range worksheet, students observe a graph and identify the domain and range of given functions. Afterwards, they solve functions to identify the range. Fifteen problems are provided on this one-page worksheet.
Curated OER
Range, Mean, Median and Mode Through the Internet
Students compute measures of central tendency. In this range, mean, median and mode instructional activity, students gather information on the internet, organize the data and then compute the measures of central tendency. ...
Curated OER
Madley Brath #39 - Stem and Leaf Plots, Mean, Median, Mode and Range
In this measures of central tendency worksheet, students draw a stem and leaf plot of a set of test scores. They compute the mean, median, mode, and range of the data set, and round the answers to the nearest tenth.
Curated OER
Ice Cream
Learners explore the concepts of mean, median, mode, and range as they elicit data about people's favorite flavor of ice cream. A practical application of the data obtained offers an extension to the lesson plan.
Texas Instruments
Graphs of Rational Functions
Take your kids on a tour of graphing rational functions. Using this TI lesson, high schoolers identify the end behavior of their functions. They find the domain and range, describe end behavior, and look at asymptotes and restrictions of...
Curated OER
Data Analysis
Young statisticians use and interpret measures of center and spread such as mean, median, and mode as well as range. They use box plots to represent their data and answer questions regarding the correspondence between data sets and the...
Curated OER
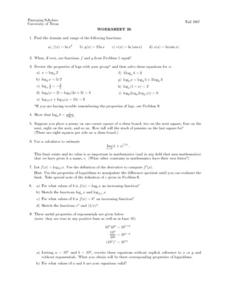
Worksheet 26 - Functions & Logarithms
For this function and logarithms worksheet, students find the domain and range of functions, use the properties of logs to solve equations. This one-page worksheet contains nine multi-step problems.
Curated OER
Profitable Soda Stand
Am I making any money? Help learners determine if their fictitious soda stand is turning a profit. They graph linear equations using the slope and y-intercept and identify the best price to use to sell soda. They identify the domain and...
Other popular searches
- Mean Median Mode Range
- Domain and Range
- Mean, Median, Mode Range
- Math Functions Domain Range
- Mean, Median, Mode, Range
- Median Mode Range
- Interquartile Range
- Fossil Range Chart
- Mean Median Mode and Range
- Domain and Range Mapping
- Domain and Range of a Function
- Andes Mountain Range


