Curated OER
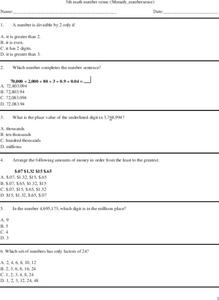
5th Grade Math Number Sense
In this grade 5 number sense worksheet, students complete a total of 25 problems covering a wide range of 5th grade math number sense concepts. Answers are included.
Curated OER
New York State Testing Program: Mathematics Grade 4
In this grade 4 mathematics testing instructional activity, 4th graders complete a total of 48 questions covering a wide range of 4th grade science concepts.
Curated OER
Write the Factors
In this factorization activity, students write the factors of the ten given numbers. The numbers given range from 2 to 10. There is an answer sheet included.
Curated OER
Wages, Salaries, and Such
Learners investigate the economics of a job by computing wages based on days, weeks and years. In this vocational lesson, students complete hourly wage worksheets based on employment information. Learners utilize average income data to...
Curated OER
Test on Limits and Continuity
Learners review concepts of logarithms for their test. In this calculus lesson plan, students review inverse function, limits, derivatives and solving logs equations. They review the chain rule and domain and range of inverse logs.
Curated OER
Polynomials Degree and Finite Differences
In this algebra activity, students identify polynomials and state the degree and rewrite it in standard form. There are 32 questions ranging from polynomials to graphing a quadratic.
Curated OER
Equivalent Fractions Worksheet: Worksheet 2, Level 3
In this fractions worksheet, learners solve 12 problems in which a fraction is analyzed. From four possible choices, students mark the fraction that is equivalent. Denominator range is from 3 to 224.
Curated OER
Equivalent Fractions Worksheet: Worksheet 5, Level 4
In this fractions worksheet, learners solve 12 problems in which a fraction is analyzed. From four possible choices, students mark the fraction that is equivalent. Denominator range is from 4 to 192.
Curated OER
Multiplication
Students complete activities for multiplication practice. In this multiplication lesson, students stand in a circle and count in twos as they go around the circle. Students also count in fives using their fingers and watch an online clip...
Curated OER
Number Ordering
Students complete number ordering activities in an online format. In this number ordering lesson, students get a number from 0 to 30 and then participate in a timed exercise to order the numbers. Students split into odd and even numbers,...
Curated OER
Organising Data
Students complete data organization activities. In this data organization lesson, students watch online clips about organizing data. Students complete an eye color frequency table for their class. Students watch a clip about asking...
Curated OER
Place Value
Students complete activities for place value practice. In this place value lesson plan, students view a place value grid practice writing numbers into the grid. Students then fill in their own place value grid for their assigned numbers....
Curated OER
Comparison -9 to +9
In this comparisons worksheet, students put the comparison symbol in between 2 numbers ranging from -9 to +9. Students complete 24 problems on 20 pages.
Curated OER
Simplifying Rational Expressions
In this algebra worksheet, students identify the properties of rational expressions. They find the domain and range. There are 5 questions with an answer key.
Curated OER
Rational Expressions
In this algebra learning exercise, students factor rational expressions. They identify the domain and range of each function. There are 47 questions.
Curated OER
Graphing Inequalities and Shading
Students graph and shade inequalities. In this algebra lesson, students graph inequalities using the slope-intercept form. They shade the side of the line that is the solution and identify the domain and range.
Curated OER
Limits
Pupils analyze data algebraically. In this calculus lesson, students determine the limit based on the 3 properties of limits. They identify the domain and range of each function.
Curated OER
Boxplots Introduction
Learners describe the pattern of a bell curve graph. In this statistics lesson, students move data around and make observation about the mean, and the quartiles. They define boxplot, outlier, range and other important vocabulary words...
Curated OER
Multiply Boxplots
Students identify the mean, quartiles and range of a boxplot. In this statistics instructional activity, students identify cooperative boxplot as it relates to the data. They make conjectures about students grade distribution.
Curated OER
Center of Mass
Students identify the geometric mean of their data. In this statistics lesson, students collect data and graph their findings. They identify the mean, range and mode.
Curated OER
Quadratic Equations and Functions
Students factor and solve quadratic equations. In this algebra lesson, students identify the domain and range of the quadratic function. They graph the parabola and identify the vertex.
Curated OER
Between Numbers
In this between numbers worksheet, students find the numbers that come between specific numbers ranging from 1 - 10. Students complete 5 problems.
Curated OER
Whose Line is it Anyway?
Students solve systems of equations. In this algebra lesson, students identify the domain and range of each function. They use the slope and y-intercept to graph each line.
Curated OER
Don't Let Parabolas Throw You
Students identify relation, function, patterns and range. In this algebra lesson, students factor and graph quadratic equations. They use transformation to move the parabola around and make predictions.
Other popular searches
- Mean Median Mode Range
- Domain and Range
- Mean, Median, Mode Range
- Math Functions Domain Range
- Mean, Median, Mode, Range
- Median Mode Range
- Interquartile Range
- Fossil Range Chart
- Mean Median Mode and Range
- Domain and Range Mapping
- Domain and Range of a Function
- Andes Mountain Range


