Bowland
Public Transport
"Statistics is the grammar of science" -Karl Pearson. In the assessment task, learners read a claim made by a newspaper and analyze its conclusions. They need to think about the sample and the wording of the given statistics.
Curated OER
Candy Bars
There is often more to data than meets the eye. Scholars learn that they need to analyze data before making conclusions as they look at data that describes the number of candy bars boys and girls eat. They disprove a given conclusion and...
Curated OER
Data Analysis & Probability
Students make predictions based on survey results. They calcuate sample proportions. Students estimate the number of voters in their district preferring the democratic candidate using their sample results. They review sample proportions...
Curated OER
Interpreting Data and Statistics
Students define random sample and complete surveys. In this algebra instructional activity, students create surveys and define the way people analyze these results. They discuss random sample as it relates to the Great Depression and...
Curated OER
Data Analysis Worksheet
In this probability activity, 11th graders solve problems using simple random sample, cluster sample, bias, population and systematic sample. They match the questions to its definition.
Curated OER
Companion Animals
Students identify ways companion animals are used to assist humans. Students identify zoonoses and list several types of. Students identify several aspects of responsible companion animal ownership. Students design, distribute, and tally...
Curated OER
Calculating Theoretical & Experimental Probability
Students collect data by conducting a survey of fellow classmates. They investigate the relationship between estimates obtained from samples and theoretical probabilities. Answer keys included.
Curated OER
The Mail Race
Students create friendly letters and surveys to other schools. In this letter writing lesson, students format friendly letters to other school and request a reply. Students chart the replies on a map and share information from the...
Curated OER
Ideas that Lead to Probability
Learners explore the concept of probability. In this probability lesson, students use random number generators to determine probabilities of events. Learners discuss if certain probable events are fair. Students determine fair ways to...
EngageNY
Summarizing Bivariate Categorical Data in a Two-Way Table
Be sure to look both ways when making a two-way table. In the lesson, scholars learn to create two-way tables to display bivariate data. They calculate relative frequencies to answer questions of interest in the 14th part of the series.
National Council of Teachers of Mathematics
Eruptions: Old Faithful Geyser
How long do we have to wait? Given several days of times between eruptions of Old Faithful, learners create a graphical representation for two days. Groups combine their data to determine an appropriate wait time between eruptions.
Curated OER
Harry Potter Research Project
Students work together to complete a research project on Harry Potter. They write a research question and develop a survey to give to their classmates. Using the results, they create a graph and draw conclusions about the data collected.
Curated OER
Analyzing Data and Finding Bias
In this algebra worksheet, students identify bias as they analyze data. They solve word problems about sampling and surveys. There are 2 questions with an answer key.
Curated OER
Variety is the Spice of Life
Students explore Gregor Mendel's work with genetics. They complete a survey of their friends and family in order to identify dominant and recessive traits. Once their surveys are complete, students discuss the ways in which dominant...
K-5 Math Teaching Resources
Small Ten Frame Cards with Dots
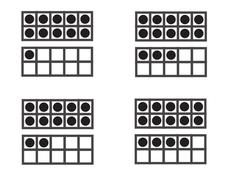
Solidify your mathematicians' addition and subtraction skills using this ten frame printable. Here, you'll find small, ten frame cards with dots representing numbers 11 to 22, equipped to enhance math strategies and boost proficiency.
Curated OER
Calculating Theoretical & Experimental Probability
High schoolers explore the concept of experimental and theoretical probability. In this experimental and theoretical probability lesson plan, students collect data by conducting a survey of their classmates. High schoolers compare their...
Curated OER
Fighting Political Apathy Among Youth
Students research and describe youth participation in political elections. They survey random adults about their voting behavior and chart the results in a graph. They compile their results to predict future voter participation.
Curated OER
Taking the human rights temperature of your school
Students, after surveying the human rights environment at the school, develop a personal action plan to improve the human rights situation within the school.
Curated OER
Embracing Diversity
Ninth graders discover that the amount surveyed affects the results and conclusions drawn from a survey. In this sampling lesson students explore the concept that a valid conclusion require a large number of entries. Students calculate...
Curated OER
Browsing Music
Students survey how the Internet has changed the way we listen to music. Research the powerful new music browser called SIMAC. Test the music field and see if this new concept helps to put in words on a sound track what couldn't be...
Curated OER
A Statistical Study on the Letters of the Alphabet
Learners use a book or magazine to research the use of letters. They complete a worksheet and compare their results.
Curated OER
Do You Have a Blog?
Ask learners about their personal writing habits, such as whether they keep a journal or a blog, or if they'd ever want to. Though this is not a fully developed lesson, you can use this article and question to provoke discussion and...
Curated OER
Data Analysis and Bias
In this probability and statistics instructional activity, students determine when a collected data or a graph of the data could be biased. The one page instructional activity contains four multiple choice questions. Answers are...
Curated OER
Scouting Civil War Sites
Middle schoolers evaluate websites after gathering information from various search engines. In this Civil War instructional activity, students browse the web and find strategies for rating websites. Middle schoolers choose the best...


