Hi, what do you want to do?
Sophia Learning
Sophia: Continuous Data
Continuous data is defined and examples are given in this lesson.
Sophia Learning
Sophia: Continuous vs Discrete Data
Explore continuous and discrete data and when to use one over the other.
Sophia Learning
Sophia: Continuous vs Discrete Data
Explore continuous and discrete data and determine when to use each one.
Sophia Learning
Sophia: Discrete Data
Explore the term discrete data and look at examples for further explanation.
Sophia Learning
Sophia: Practical Applications of the Bell Shaped Curve
Explore the bell-shaped curve and how to calculate a z score. Additional links provided to further knowledge on outliers.
Alabama Learning Exchange
Alex: M&m's and Blogs: Interpreting Data!
In this hands-on, technology-rich lesson, students will interpret data. The students will define words involving graphs, create a bar graph using M&M's, and post information from their findings on the internet. The students will also...
Alabama Learning Exchange
Alex: Beep! Beep! Move Over! I Am Going to Be Late!
During this instructional activity, middle schoolers will investigate how to "clear up" the "Traffic Jam." They will be using large manipulatives (their bodies), small manipulatives (carpet squares), and technology (the Java applet) to...
Khan Academy
Khan Academy: Data Inferences Harder Example
This video resource from Khan Academy provides practice questions for the SAT Math. Watch Sal work through a harder Data inferences problem. We make a confidence interval by starting with a sample result and adding and subtracting the...
Sophia Learning
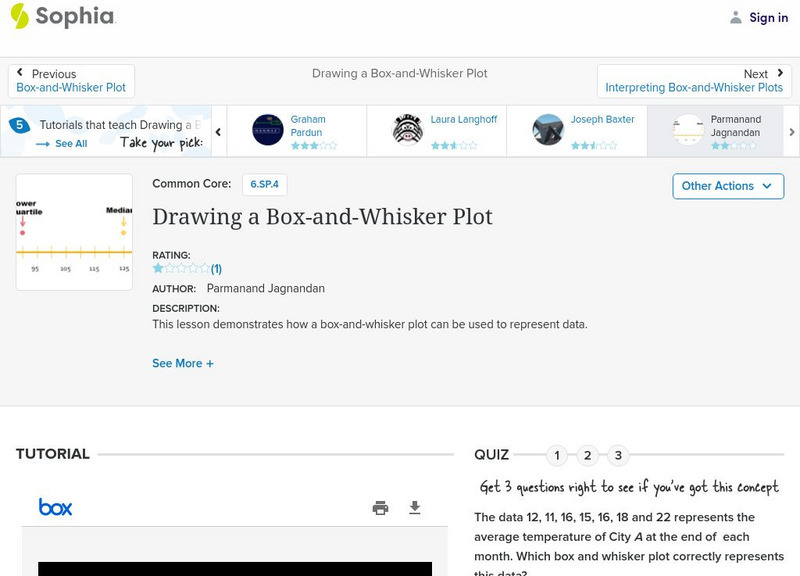
Sophia: Drawing a Box and Whisker Plot
This lesson demonstrates how a box-and-whisker plot can be used to represent data.
Sophia Learning
Sophia: Representing Data With Box and Whisker Plots
This lesson demonstrates how a box-and-whisker plot can be used to represent data.
Sophia Learning
Sophia: Representing With Box and Whisker Plots: Lesson 1
This lesson demonstrates how a box-and-whisker plot can be used to represent data. It is 1 of 3 in the series titled "Representing with Box-and-Whisker Plots."
Scientific American
Scientific American: Smart People Believe Weird Things
This article, published by Scientific American (September 2002), explores how smart people can believe weird and silly things. The article comes to the conclusion that our beliefs are shaped more by our environment than our understanding...
Khan Academy
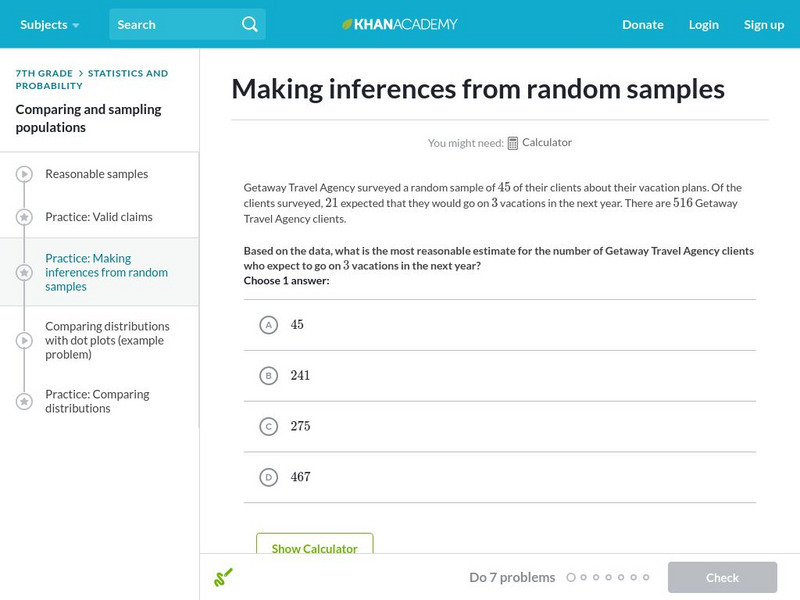
Khan Academy: Making Inferences From Random Samples
Practice making inferences from random samples.
Khan Academy
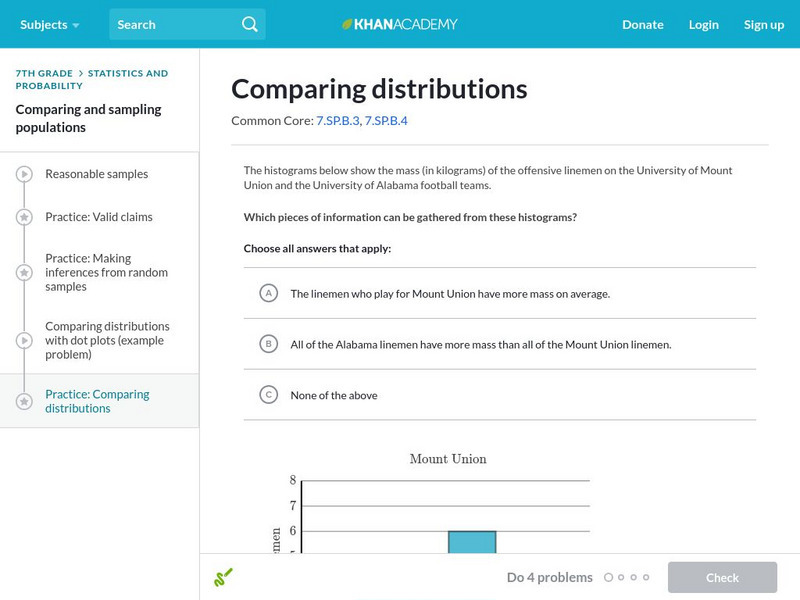
Khan Academy: Comparing Distributions
Practice comparing distributions of data in different forms of graphical representation.
Khan Academy
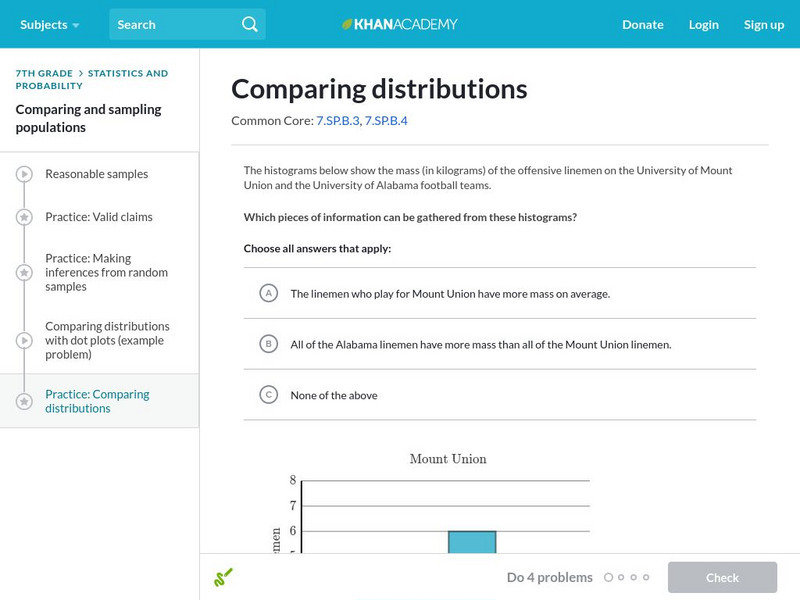
Khan Academy: Comparing Distributions
Try these practice problems comparing distributions.


