Hi, what do you want to do?
Cyberbee
Adventures of Cyberbee: Graphing
Teacher-directed lesson plan focusing on data analysis, graphing, and probability. Lesson includes a video and engaging spreadsheet activities.
Shodor Education Foundation
Shodor Interactivate: Lesson: Fire!, Probability, and Chaos
Students will simulate the probability of a forest fire then graphing the data.
The Math League
The Math League: Ratio and Proportion
This tutorial provides definitions and examples of ratios and proportions and features comparing ratios and converting rates.
CK-12 Foundation
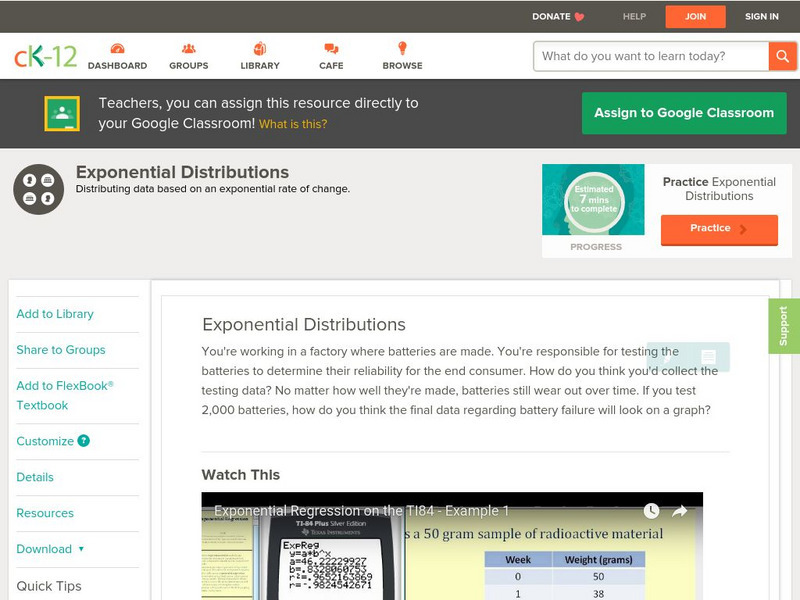
Ck 12: Probability: Exponential Distributions
[Free Registration/Login may be required to access all resource tools.] Covers exponential distributions. Presents examples using a graphing calculator as well as guided and independent practice questions.
Texas A&M University
Wtamu Virtual Math Lab: Beginning Algebra: Reading Graphs
A good introduction to reading bar, line, and double line graphs, and drawing and reading Venn diagrams. Contains definitions and examples of these types of charts and graphs as well as practice exercises that ask you to answer questions...
Alabama Learning Exchange
Alex: Box and Whisker With a Bed Sheet
The class will make a list of all of their classmates heights, ages in months, and shoe sizes. They will then use this data to create a human box-and-whisker plot. This lesson plan was created as a result of the Girls Engaged in Math and...
Khan Academy
Khan Academy: Picture Graphs (Pictographs) Review
Picture graphs are a fun way to display data. This article reviews how to create and read picture graphs (also called pictographs).


