Hi, what do you want to do?
Wikimedia
Wikipedia: Matematica Discreta
In Spanish. Overview of discrete math and various related topics. Also discusses the theories and mathematicians behind finite math.
Other
Hsor.org: Miguel Chooses a College: Tradeoffs
Use several strategies and criteria to help Miguel determine the college for him.
Sophia Learning
Sophia: Continuous Data
Continuous data is defined and examples are given in this lesson.
Sophia Learning
Sophia: Continuous vs Discrete Data
Explore continuous and discrete data and when to use one over the other.
Sophia Learning
Sophia: Continuous vs Discrete Data
Explore continuous and discrete data and determine when to use each one.
Sophia Learning
Sophia: Discrete Data
Explore the term discrete data and look at examples for further explanation.
National Council of Teachers of Mathematics
Nctm: Illuminations: Advanced Data Grapher
The Advanced Data Grapher can be used to analyze data with box plots, bubble graphs, scatterplots, histograms, and stem-and-leaf plots.
TED Talks
Ted: Ted Ed: Hans Rosling Shows the Best Stats You've Ever Seen
Explore collected data in regards to life expectancies, family size, and finances through out the world and the various ways the data has been displayed.
Texas Instruments
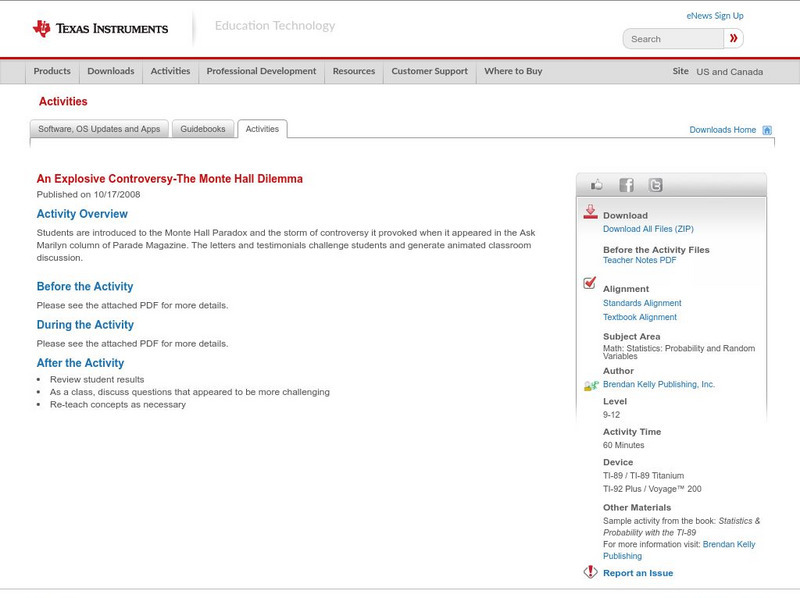
Texas Instruments: An Explosive Controversy the Monte Hall Dilemma
Students are introduced to the Monte Hall Paradox and the storm of controversy it provoked when it appeared in the Ask Marilyn column of Parade Magazine. The letters and testimonials challenge students and generate animated classroom...
Sophia Learning
Sophia: Continuous Data Tutorial
Continuous data is defined and explained in this video.
Sophia Learning
Sophia: Practical Applications of the Bell Shaped Curve
Explore the bell-shaped curve and how to calculate a z score. Additional links provided to further knowledge on outliers.
Alabama Learning Exchange
Alex: Beep! Beep! Move Over! I Am Going to Be Late!
During this lesson, students will investigate how to "clear up" the "Traffic Jam." They will be using large manipulatives (their bodies), small manipulatives (carpet squares), and technology (the Java applet) to find the relationship...
Texas A&M University
Wtamu Virtual Math Lab: Beginning Algebra: Reading Graphs
A good introduction to reading bar, line, and double line graphs, and drawing and reading Venn diagrams. Contains definitions and examples of these types of charts and graphs as well as practice exercises that ask you to answer questions...
Alabama Learning Exchange
Alex: My Peanut Butter Is Better Than Yours!
The students will engage in the process of statistical data comparing data using tables and scatterplots. The students will compare data using measures of center (mean and median) and measures of spread (range). This lesson can be done...
Alabama Learning Exchange
Alex: Let's Make a Pie
The students will survey their classmates and construct circle graphs to display their results. Students will produce circle graphs using a compass and protractor, and then with an interactive computer program.This lesson plan was...
Texas Instruments
Texas Instruments: What Are the Chances?
In this activity, students determine the probability of a spinner landing on a certain number in eleven trials. They also learn to change the weightage and find subsequent effect on the probability.
Texas Instruments
Texas Instruments: Numb3 Rs: Is It for Real?
Based off of the hit television show NUMB3RS, this lesson uses sabermetrics (study of statistics of baseball) to try to determine when certain players had "change points," or times when their performance drastically changed. This is done...
Texas Instruments
Texas Instruments: Using the Ti 83/84 to Explore the Binomial Theorem
This lesson will introduce students to the binomial theorem through a variety of activities. Pascal's triangle and probabilities will be explored through problem solving. The binomial theorem, combinations formula, and the binomial...
Texas Instruments
Texas Instruments: Venn Diagrams
This set contains statistics questions about Venn diagrams. The student interprets when a Venn diagram suggests such event pairs as mutually exclusive, complementary, and independent events, and uses these diagrams in determining...
Texas Instruments
Texas Instruments: Tiles in a Bag
How many tiles would you have to pick to be confident that your estimated probability truly represents the situation? In this activity, you will draw a tile from a bag, record its color and put it back in the bag. The bag contains 24...
Wolfram Research
Wolfram Math World: Matrix
From Mathworld.com as site on Maxtricies. Includes formulas, definitions, and links to related articles.
Beacon Learning Center
Beacon Learning Center: Leap Frog Experiment
Students design an experiment, collect information using tree diagrams, and interpret the results using charts in this interactive web lesson.
Texas Instruments
Texas Instruments: Heavy Hitting #2
This activity uses baseball's slugging average to compute weighted means using summary statistics. Some students may need an explanation of the terms singles, doubles, triples, and home runs.
Illustrative Mathematics
Illustrative Mathematics: S Id, F if Laptop Battery Charge
This task uses a situation that is familiar to young scholars to solve a problem they probably have all encountered before: How long will it take until an electronic device has a fully charged battery? Given data, students perform a...


