Hi, what do you want to do?
Khan Academy
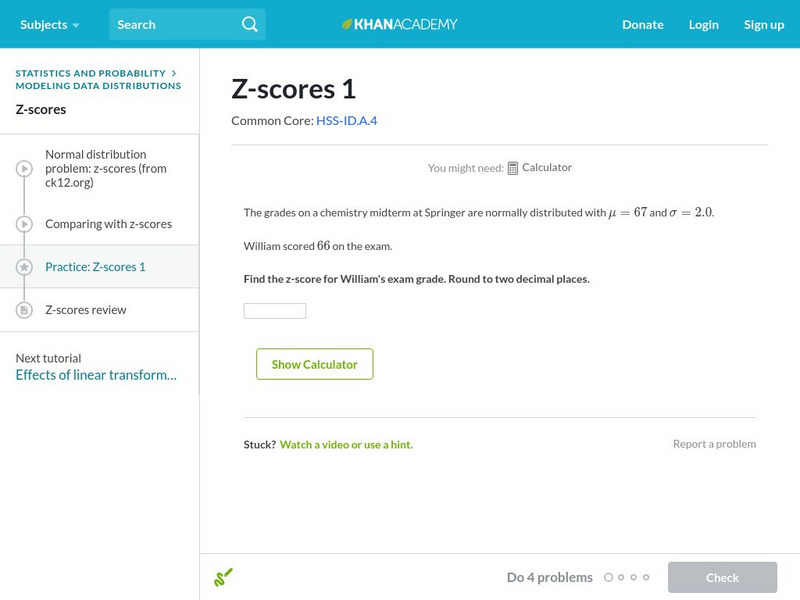
Khan Academy: Z Scores 1
Find the z-score of a particular measurement given the mean and standard deviation. Students receive immediate feedback and have the opportunity to try questions repeatedly, watch a video or receive hints.
Khan Academy
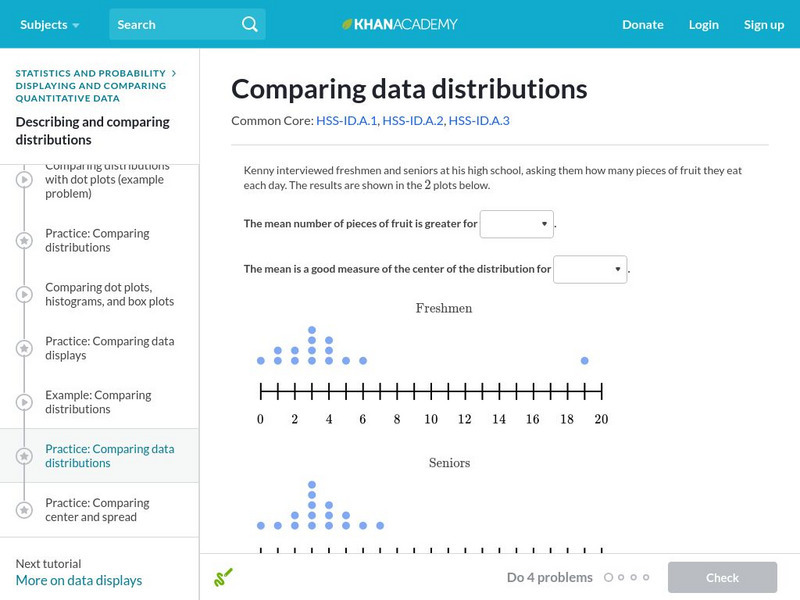
Khan Academy: Comparing Data Distributions
Take a look at two different data distributions and draw some comparisons. Students receive immediate feedback and have the opportunity to try questions repeatedly, watch a video or receive hints.
CK-12 Foundation
Ck 12: Interactive Algebra 1 for Ccss
This is a complete, full-year Algebra 1 course with interactivity included in every lesson. Some lessons include videos, and all include interactives and inline questions that offer instant, per-answer feedback. Every lesson also has...
Ministerio de Educacion, Cultura y Deporte (Spain)
Pagina De Educacion Matematica
In Spanish. A variety of multiple choice probability questions varying in difficulty. Also includes problems on statistics and trigonometry. a great preparation site for post secondary classes. Solutions are not provided.
Other
Utah St. Univ.: Coin Tossing Applet
An interesting Applet that simulates the toss of a coin 100 times. A quick count of the results and an accompanying graph make this site useful for both teacher and student.
National Council of Teachers of Mathematics
The Math Forum: The Cereal Box Problem
A cereal company is offering six different prizes in their boxes. How many boxes would you expect to have to purchase in order to collect all six prizes? Known as the Cereal Box Problem, this question is explored here. A solution is...
Richland Community College
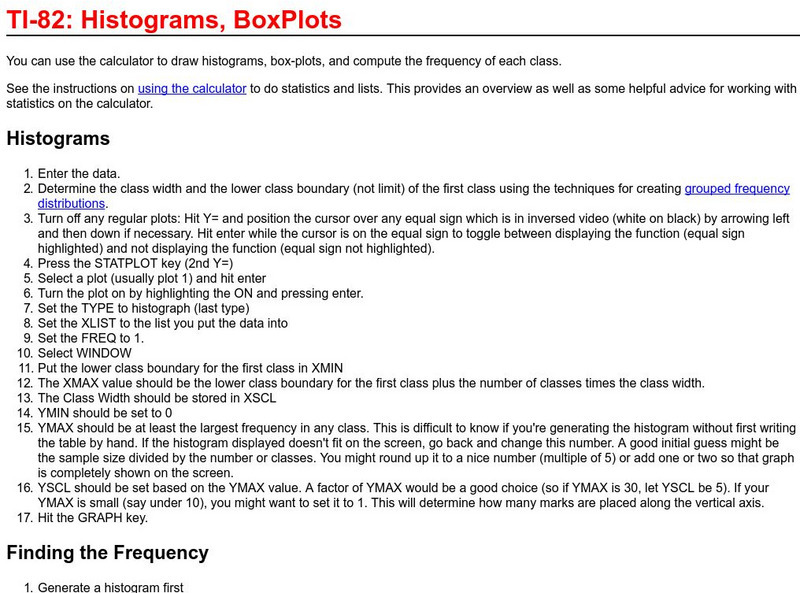
Richland College: Ti 82 Histograms / Box Plots
Richland College provides a step-by-step procedure on how to use a TI-82 to construct histograms and box plots and then use this to find frequency distribution.
Khan Academy
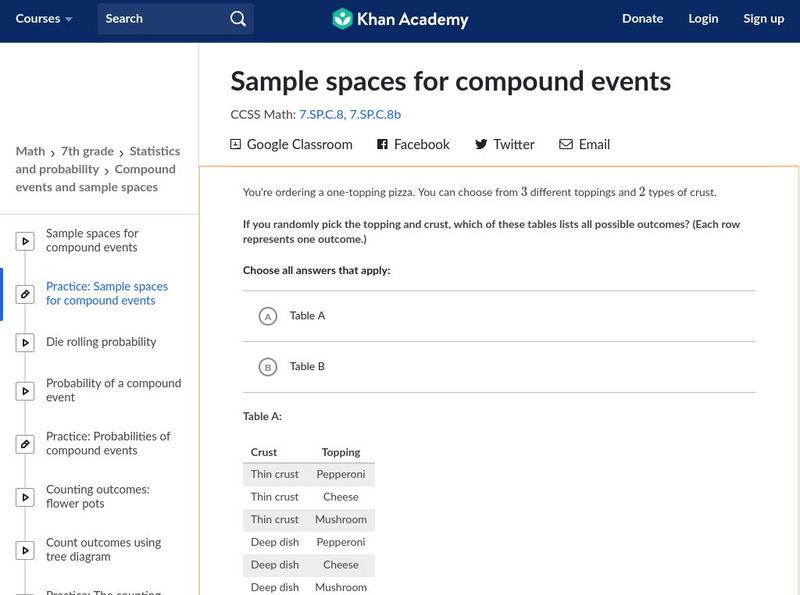
Khan Academy: Sample Spaces for Compound Events
Practice interpreting diagrams and sample spaces to find the probability of outcomes.
Other
Clayton State: Linear Regression
Introductory look at linear regression. Notes presented in outline form, with key concepts and formulas given. An example is presented at the end.
Khan Academy
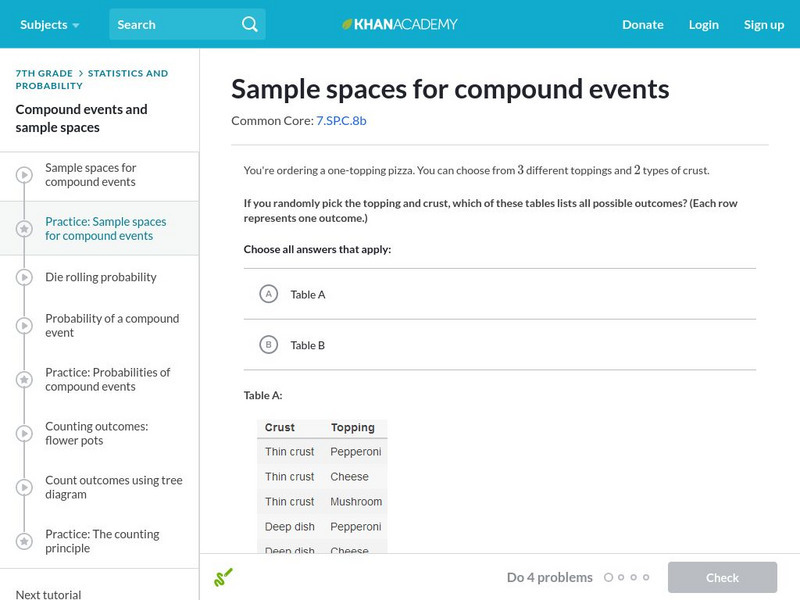
Khan Academy: Sample Spaces for Compound Events
Practice checking if sample space diagrams match a compound event. Students receive immediate feedback and have the opportunity to try questions repeatedly, watch a video or receive hints.
McGraw Hill
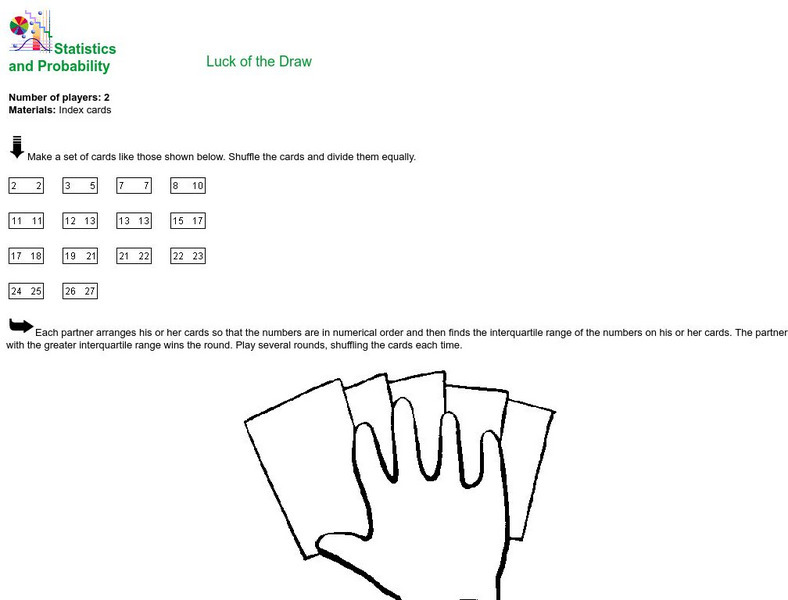
Mc Graw Hill Education: Glencoe: Statistics and Probability: Luck of the Draw
Instructions for creating and playing a simple card game through which students can practice calculating the interquartile range from a set of numbers.
PBS
Pbs Learning Media: When Does 50 50 Become 50 50?
In this video segment from Cyberchase, Bianca goes on a quest to find out if a coin toss really is a 50-50 proposition.
Texas Instruments
Texas Instruments: The Normal Distribution
Students graph normal distributions, shade desired areas, and find related probabilities. They graph Normal probability scatter plots to check the normal (linear) shape of a data distribution.
Other
Web Quest: Take Me Out to the Ball Game
This is a WebQuest written by Susie Hallar of the Warrensburg Schools in Warrensburg, Missouri. Students research 10 famous baseball players, then use the information they find to compute averages, standard deviations, central...
Texas Instruments
Texas Instruments: Weather Study With Ti Interactive
Students will extract weather data from the web for several major cities. They will then display and discuss the data.
Texas Instruments
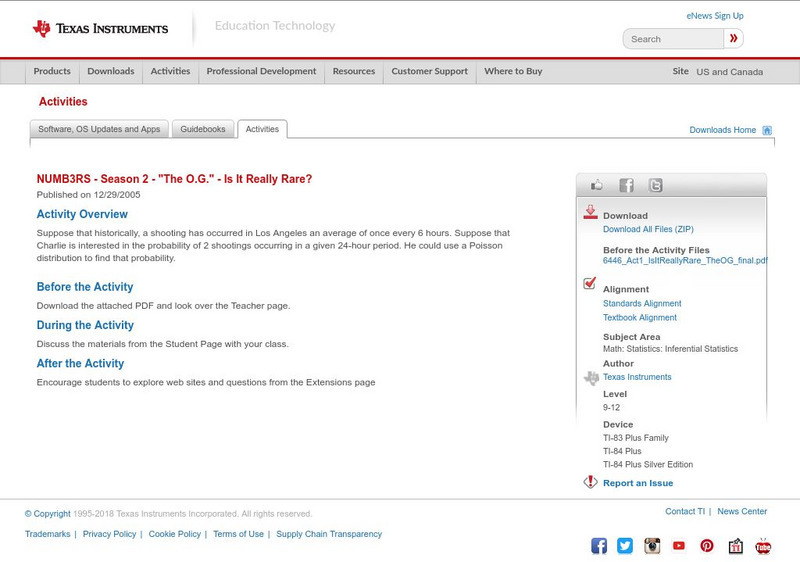
Texas Instruments: Numb3 Rs: Is It Really Rare?
Based off of the hit television show NUMB3RS, this lesson introduces students to the Poisson Distribution to determine the probability of events happening a certain number of times in a given time period. The lesson is framed in the...
Stefan Warner and Steven R. Costenoble
Finite Mathematics & Applied Calculus: Uniform Distribution
Students learn about probability density functions and uniform distributions. The tutorial investigates the statistics concepts through class notes and examples. Review exercises are included.
Palomar Community College District
Palomar College: The Normal Curve an Example
A collection of step-by-step worked problems demonstrating how to take a normal curve and determine the probability (area) under it. Hints are provided along the way and the final measures are shown for the user to check.
Ministry of Education and Universities of the Region of Murcia (Spain)
Ministerio De Educacion Y Ciencia: Distribuciones De Probabilidad
Learn about normal distribution, calculate odds on normal distributions and fit a set of data to a normal distribution.
Other
Fayetteville State University: Z Distributions
The introductory paragraph explains Z-Distributions, their spread, and the ability to find certain values within the distribution. Two animated graphs are then provided as an example of the probability of the normal distribution curve.
CK-12 Foundation
Ck 12: Algebra: Fitting Lines to Data
[Free Registration/Login may be required to access all resource tools.] Make a scatter plot of data and find the line of best fit to represent that data.
Math Planet
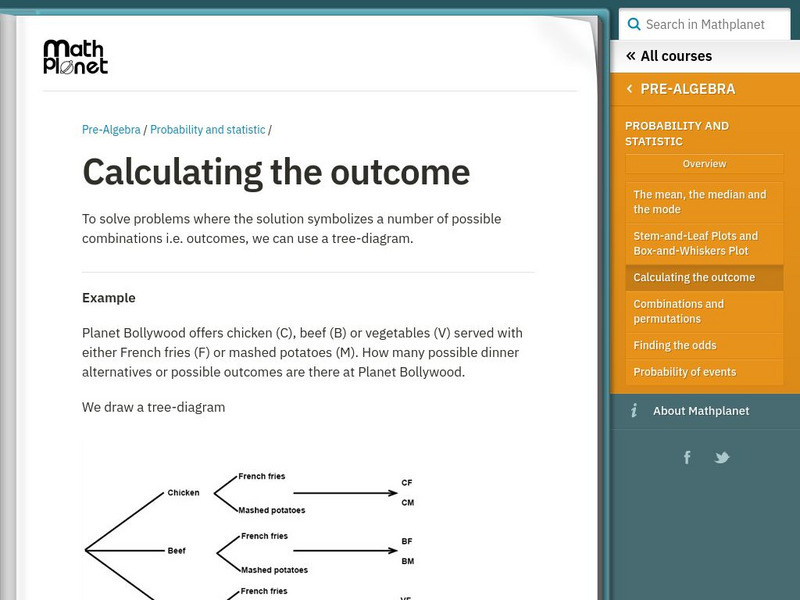
Math Planet: Calculating the Outcome
Gain an understanding of how to calculate the outcome using a tree-diagram by viewing an example and a video lesson.
ESPN Internet Ventures
Espn: Billie Jean Won for All Women
Although she won numerous tennis championships, Billie Jean King will probably always be remembered for her victory against Bobby Riggs in the "Battle of the Sexes". Biographical facts and career statistics are included at this ESPN site.


