Shodor Education Foundation
Shodor Interactivate: Lesson: Fire!, Probability, and Chaos
Students will simulate the probability of a forest fire then graphing the data.
Stefan Warner and Steven R. Costenoble
Finite Mathematics & Applied Calculus: Review Exercises: Random Variables and Statistics
Students review random variables and statistics. The resource consists of review exercises on the mathematics concepts.
Stefan Warner and Steven R. Costenoble
Finite Mathematics & Applied Calculus: Quiz: Random Variables and Statistics
The online quiz assesses student comprehension of math concepts. The quiz consists of true/false questions about random variables and statistics.
University of Colorado
University of Colorado: Ph Et Interactive Simulations: Plinko Probability
Drop balls through a triangular grid of pegs and see them accumulate in containers. Switch to a histogram view and compare the distribution of balls to an ideal binomial distribution. Adjust the binomial probability and develop your...
Cuemath
Cuemath: Probability
A comprehensive guide for learning all about probability with definitions, basics of probability, terms used in probability, probability formula, conditional probability, probability distribution, probability density function, law of...
Texas Instruments
Texas Instruments: Will Girls and Boys Be Equal?
Students explore concepts in probability and statistics. In this activity, they model a situation to find experimental probability and construct a box-and-whisker plot. They compare the experimental and theoretical probabilities for the...
University of Baltimore
University of Baltimore: Short History of Probability & Statistics
Several brief paragraphs give a short account of the history of the study of probability and statistics. Also included are many additional resources for referencing. Written by Dr. Hossein Arsham
Dartmouth College
Dartmouth College: An Introduction to Probability
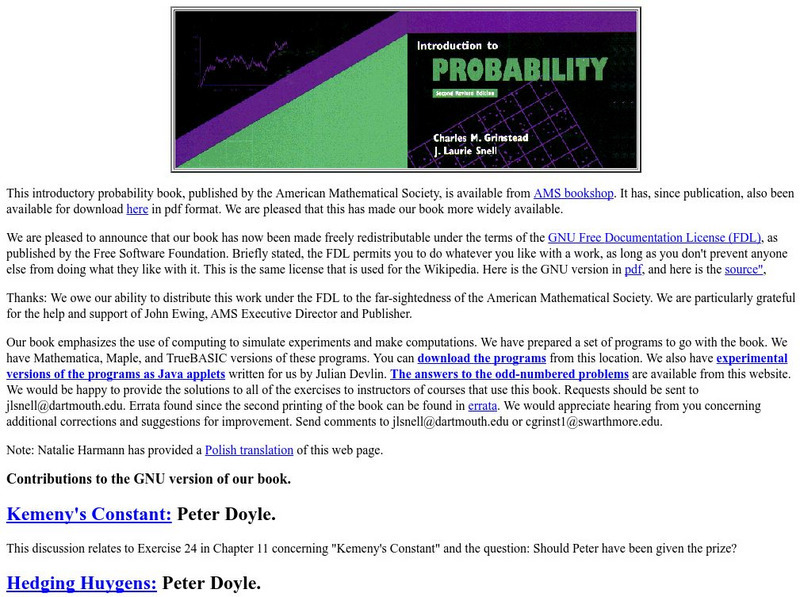
This site provides an introduction to probability book that is available for download. It also gives tips on how to teach and learn the concept of probability.
City University of New York
Scientific Method and Probability: Interactive Activity
This interactive lesson begins with the basics and carries through to methods of data analysis, all interactively. Supporting material is excellent.
Math Drills
Math Drills: Statistics and Probability Worksheets
Download these free worksheets to sharpen your skills with statistics and probability. Sheets focus on collecting and organizing data, measures of central tendency (mean, median, mode, and range), and probability.
Cut the Knot
Cut the Knot: Probability Questions
This site defines probability and has a computer-based random number generator. The site has links to more than 100 probability problems which require some prior statistical knowledge to solve, or they can be great "openers" for teachers...
CK-12 Foundation
Ck 12: Introduction to Data and Measurement Issues Grades 11 12
[Free Registration/Login may be required to access all resource tools.] This Concept familiarizes students with data analysis and statistical terminology.
Texas Instruments
Texas Instruments: Cannibal Critters and Cannibal Critters Cont.
Students will explore probability and statistics using predictions and histograms. Theoretical and experimental probability will also be examined.
Rice University
Hyper Stat Online Statistics Textbook: Logic of Hypothesis Testing
High level detailed steps including null hypothesis, alternative hypothesis, significance level, statistics, probability value and statistical significance.
University of Colorado
University of Colorado: Ph Et Interactive Simulations: Plinko Probability
Play Plinko and develop your knowledge of statistics. Drops balls through a triangular grid of pegs and see the balls random walk through the lattice. Watch the histogram of final positions build up and approach the binomial distribution.
Khan Academy
Khan Academy: Probability: The Basics
Provides an introduction to probability. Includes examples, two videos, and links to additional resources, e.g., exercises to try. There are also problems and discussions of them in the Comments section.
Vision Learning
Visionlearning: Data: Statistics in Science
An explanation of how statistics allows scientist to explore the degree of uncertainty that accompanies conclusions that are based on data collected during experimentation and research.
Annenberg Foundation
Annenberg Learner: Learning Math: Min, Max and the Five Number Summary
Explore how to interpret a large set of data by dividing it up into smaller portions in order to answer statistical questions.
Other
42e Xplore: Statistics and Probability
An extensive collection of links on statistics and probability can be found here! Discussions ranging from the basics of stats through more complex data analysis. Topics are broken down into sections for teachers, students, WebQuest...
Khan Academy
Khan Academy: Addition Rule for Probability (Basic)
Venn diagrams and the addition rule of probability.
Khan Academy
Khan Academy: Making Predictions With Probability
Practice predicting the number of times a certain event will happen. Students receive immediate feedback and have the opportunity to try questions repeatedly, watch a video or receive hints.
National Council of Teachers of Mathematics
The Math Forum: Urban Systemic Initiative/oceans of Data
This site includes questions related to reading and understanding graphs. There are links on this site to lesson plans, benchmarks, and other webpages all of which mostly center about probability and statistics.
Teachnology
Teachnology: Teacher Guide to Probability and Statistics
Statistics Theme provides a collection of free sample worksheets, teacher resources, lesson plans and interactive media for grades k-12.
Texas Instruments
Texas Instruments: Conditional Probability & Bayes Formula
This set contains statistics questions regarding conditional probability and Bayes' formula. The student applies Bayes' formula to various real-world problems.


