Curated OER
Earth Kids: Kindergarteners Taking Care of the Earth
Students explore a variety of ways of how to care for the environment in the nine lessons of this unit. They observe how to be responsible "Earth Kids."
Curated OER
Fraction Dominoes
Fourth graders participate in a math game that involves practicing their equivalent fraction skills in the advanced multiplication stage seven. They assess their ability skills of equivalent fractions to match twenty seven dominoes on...
Curated OER
Line of Best Fit
Students explore the concept of linear regression. In this linear regression lesson, students do a Barbie bungee activity where they collect linear data. Students plot their data using a scatter plot. Students determine a line of best...
Curated OER
Missing Macroinvertebrates
High schoolers investigate the concept of a macroinvertebrate. They observe the presence of increases or decreases in population in order to test for factors that contribute to the extinction of a species. Students predict the likelihood...
Curated OER
All Those Advertising Dollars!
Students calculate percent increases (or percent decreases) for the top 25 companies in terms of advertising dollars spent during a year.
Massachusetts Institute of Technology
Mit: Open Course Ware: Introduction to Probability and Statistics
The online course consists of educational materials about probability and statistics. Lecture notes, exams, and assignments are included.
Wolfram Research
Wolfram Math World: Probability and Statistics
This is a resource for many topics in probability and statistics. Click on the topic of your choice for an explanation. The sites you will be linked to are quite extensive. A degree of higher-level math is necessary for understanding...
National Council of Teachers of Mathematics
The Math Forum: Probability and Statistics
This page is a math home page that includes information on all topics of probability and statistics.
Other
Math Pages: Probability and Statistics
Over 60 links are provided here for topics in probability and statistics. Each link provides an in-depth discussion and example problems.
University of Regina (Canada)
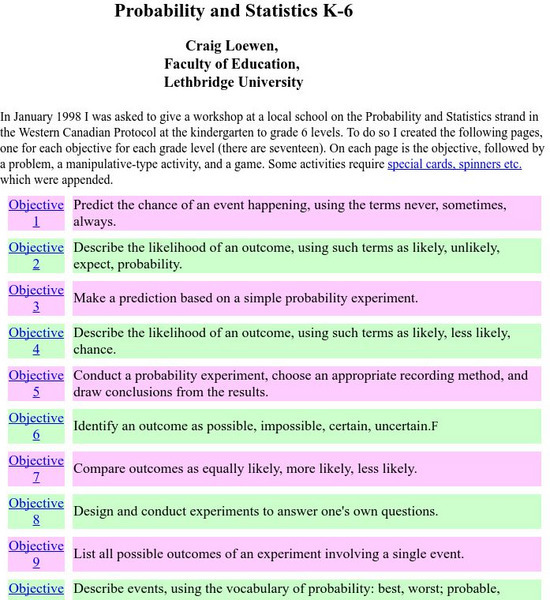
University of Regina: Math Central: Probability and Statistics K 6
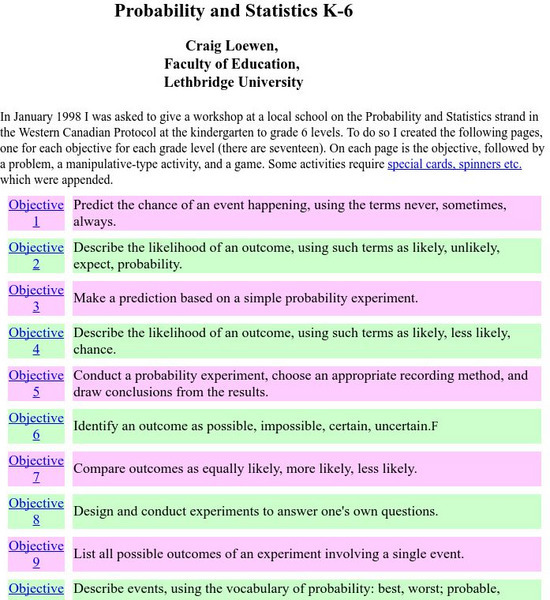
A compilation of resources devoted to teaching probability and statistics. The resources are broken into seventeen different objectives that have a problem, activity, and a game.
Other
Uah: Virtual Labs in Probability and Statistics
This page provides links to various interactive experiments in probability and statistics.
Other
Schaum's Outlines: Probability and Statistics
This comprehensive study guide contains 897 fully solved probability and statistics problems with explanations. Topic covered includes basic probability, sampling theory, regression, and more.
University of Regina (Canada)
University of Regina: Math Central: Probability and Statistics K 6
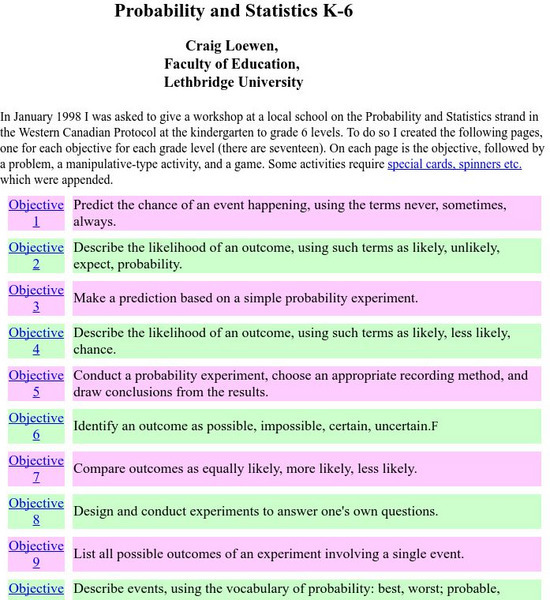
A compilation of resources devoted to teaching probability and statistics. The resources are broken into seventeen different objectives that have a problem, activity, and a game.
University of Regina (Canada)
University of Regina: Math Central: Probability and Statistics K 6
A compilation of resources devoted to teaching probability and statistics. The resources are broken into seventeen different objectives that have a problem, activity, and a game.
Interactive Mathematics
Interactive Mathematics: Probability and Statistics
Mini lessons are provided for learning concepts in the world of probability and statistics. Topics include counting and probability, permutations, combinations, independent and dependent events, and distributions. Links to online...
Ducksters
Ducksters: Kids Math: Probability and Statistics Glossary and Terms
Math glossary and terms on probability and statistics for kids. Learn the definitions used in this mathematics subject such as mean, median, and mode on this site.
University of Regina (Canada)
University of Regina: Math Central: Probability and Statistics K 6
A compilation of resources devoted to teaching probability and statistics. The resources are broken into seventeen different objectives that have a problem, activity, and a game.
Soft Schools
Soft Schools: Probability and Statistics Quiz
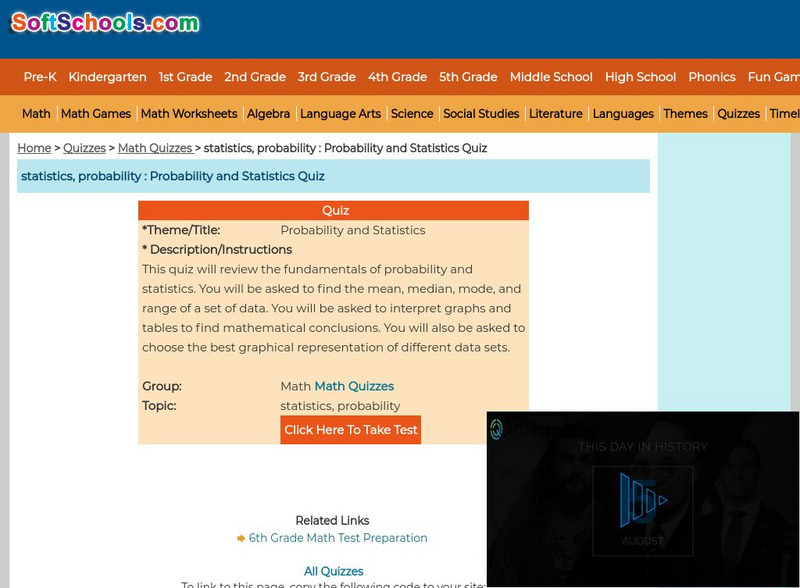
Students are asked to find the mean, median, mode, and range of a data set. Also, they must be able to interpret graphs and tables, and graphically represent data. The quiz is multiple choice and consists of nine questions, and a summary...
Mathigon
Mathigon: Probability and Discrete Math: Casino Mathematics
This lesson focuses on the probability and casino games such as Roulette which consists of a wheel with the numbers from 1 to 36 colored in red and black, as well as a green 0. A ball rolls around the outside and randomly lands on one of...
Khan Academy
Khan Academy: Center and Spread Lesson
The resource from Khan Academy provides practice questions for the Praxis Core Math Test. This section reviews probability and statistics questions connected to the center and spread of data in a collection.
Oswego City School District
Regents Exam Prep Center: Problems Involving and & Or
This tutorial helps students understand the probability of two events occurring when the words AND & OR are used. There are examples and practice problems. The teacher resource pages include a demonstration and a computer simulation.
Shodor Education Foundation
Shodor Interactivate: Lesson: Conditional and Simultaneous Probability
This lesson plan deals with conditional probability and the probability of simultaneous events. Problems included in this lesson tend to have solutions that are counterintuitive. This presents an opportunity to investigate more deeply...
National Council of Teachers of Mathematics
The Math Forum: Prob/stat Classroom Materials
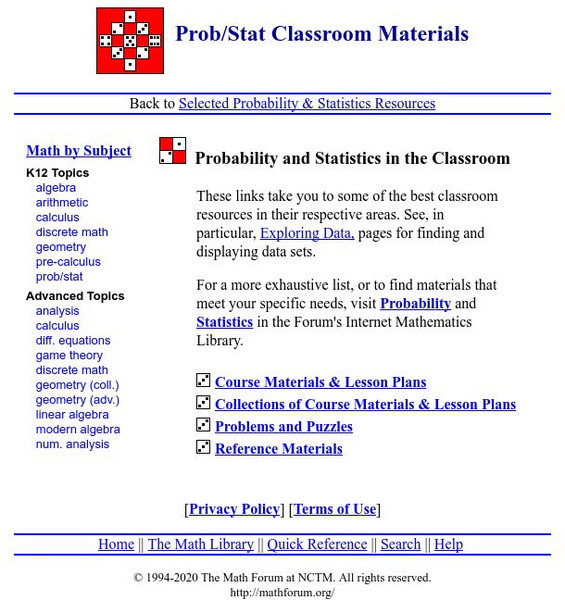
This site provides links to lesson plans, example problems, and software sites for probability and statistics.
Khan Academy
Khan Academy: Conditional Probability and Independence
In probability, we say two events are independent if knowing one event occurred doesn't change the probability of the other event. Examples and questions about conditional probability.


