Hi, what do you want to do?
Curated OER
Risk Taker - Probability Web Quest
Students complete an on line, teacher created, webquest to study the origin of probability, theoretical and simulated probability; computing the probability of two independent events; and mutually exclusive events. They make a Venn...
Curated OER
Baseball Math
Students collect data on baseball plays. In this statistics lesson, students graph their data and make predictions based on their observation. They calculate what the probability is that a favorable outcome would happen.
Curated OER
Pancakes, Anyone?
First graders explore data collecting and graphing. In this data collecting and graping lesson plan, 1st graders watch a video about monster who sells pancakes. Students make a graph to record the most popular pancake. Students also play...
Curated OER
Height versus Shoe Size
Students find a correlation between a person's height and his/her shoe size. They have access to entering data into lists on a graphing calculator and can complete scatter plots. Students read and interpret a scatter plot and use the...
Curated OER
No Foot, No Horse
Why do horses wear shoes? Why do people wear shoes? Using worksheets, which are embedded in the plan, learners write descriptive paragraphs about their own shoes, classify a pile of shoes, and also engage in math games about the variety...
Curated OER
And Around We Go!
Sixth graders conduct a survey and collect data to construct a bar graph that will then be changed into a circle graph. With the bar graph, 6th graders compare estimated fractions and percentages and estimate percentages. With the circle...
Curated OER
The Math Reaction
High schoolers use the reaction time to figure out problems. They use the following example to get them started with reaction time: the edge of a ruler is placed near a person's thumb and index finger and, without warning, the ruler is...
Curated OER
"A Closet Full of Shoes" and Picture Puzzle Piece" by Shel Silverstein
Students explain the concept of simple probability.
Curated OER
Tessel Your Way to Nagano!: Olympics, Winter Sports, Snowboarding, Graphic Design, Geometry, Math, M.C. Escher, Tessellations
Students create Post-It note fundamental regions to tesselate. They make tesselations using computer software or websites. They create a jacket design with tesselation and determine the cost of production.
Curated OER
Football Statistics
In this math worksheet, students examine the statistical information as provided in the graphic organizer and calculate the other values.
Curated OER
Who Plays What?
Ninth graders divide in pairs 3 cards with the words possible, impossible and certain on them. Ask questions of the class and get the students to hold up the word that describes the event (for example) Tomorrow it will snow. You have...
Curated OER
Standard Linear Form
Ninth graders identify and describe the x-intercept as the place where the line crosses the x-axis as it applies to football. They create their own differentiations to reinforce the distinction between the x-intercept and the...
Curated OER
My World - Africa Scavenger Hunt
Students explore the lives of students living in Africa, learn African traditions, and compare and contrast their lives with the lives of African Students.
Curated OER
What Are The Risks From Radon?
Students examine the health risks of radon in the home. They calculate the odds for each risk and use different forms of measurement. They work together to complete the activity and worksheet.
Curated OER
The Basketball Tournament
Students estimate how many games are played if six teams play each other once. They investigate their own way and discuss possible strategies they might use. They then share their findings with the class.
Curated OER
The Bigger they Are . . .
Students do a variety of data analyses of real-life basketball statistics from the NBA. They chart and graph rebounding, scoring, shot blocking and steals data which are gathered from the newspaper sports section.
University of Cambridge
University of Cambridge: Maths and Sports: Archery
Use our interactivity to simulate picking up a bow and some arrows and trying to hit the target a few times. Can you work out the best settings for the sight? This activity gives an opportunity to gather and collate data, and to test...
University of Cambridge
University of Cambridge: Maths and Sports: Arsenal Collection: Football Formations
How many different football team formations can you find? This activity provides an engaging real-life context to investigate simple combinations, and is aimed at Key Stage 3 students.
University of Cambridge
University of Cambridge: Maths and Sports: The Games' Medals
Who could have won the gold, silver and bronze medals? This activity is designed to be accessible to primary pupils at Key Stage 1.
University of Cambridge
University of Cambridge: Maths and Sports: Who's the Winner?
If two goals are scored in a hockey match between two equally-matched teams, what are the possible scores? This activity gives an opportunity to investigate probability in the context of sport, and is designed to be accessible to...
University of Cambridge
University of Cambridge: Maths and Sports: Any Win for Tennis?
What are the probabilities of winning at tennis? This challenging activity is designed to be accessible to students of A-Level Maths (grades 10, 11, and 12).
University of Cambridge
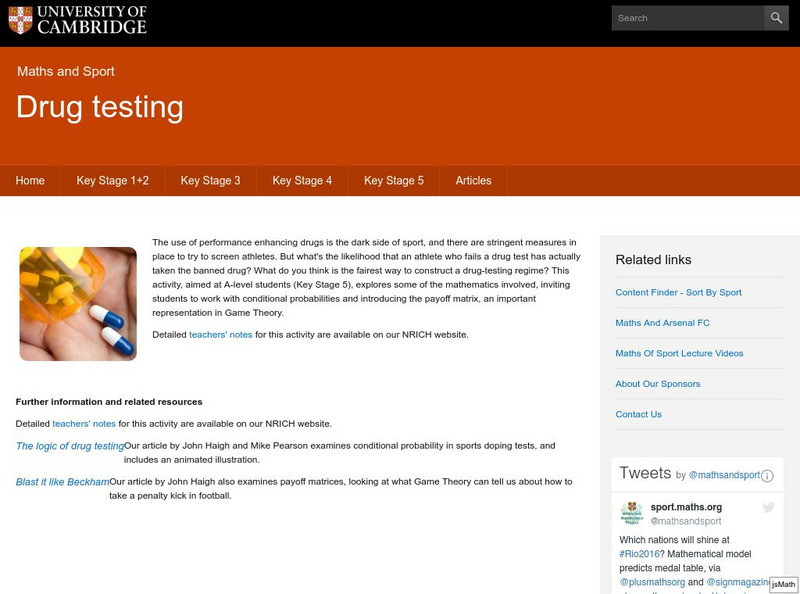
University of Cambridge: Maths and Sports: Drug Testing
The use of performance enhancing drugs is the dark side of sport, and there are stringent measures in place to try to screen athletes. But what's the likelihood that an athlete who fails a drug test has actually taken the banned drug?...
University of Cambridge
University of Cambridge: Maths and Sports: What's the Point of Squash?
Squash isn't an Olympic sport (yet!) but it has an interesting scoring system. If you reach 8-all in a game of squash, when should you decide to play to 9 points rather than 10? This activity is a starting point for mathematical...
University of Cambridge
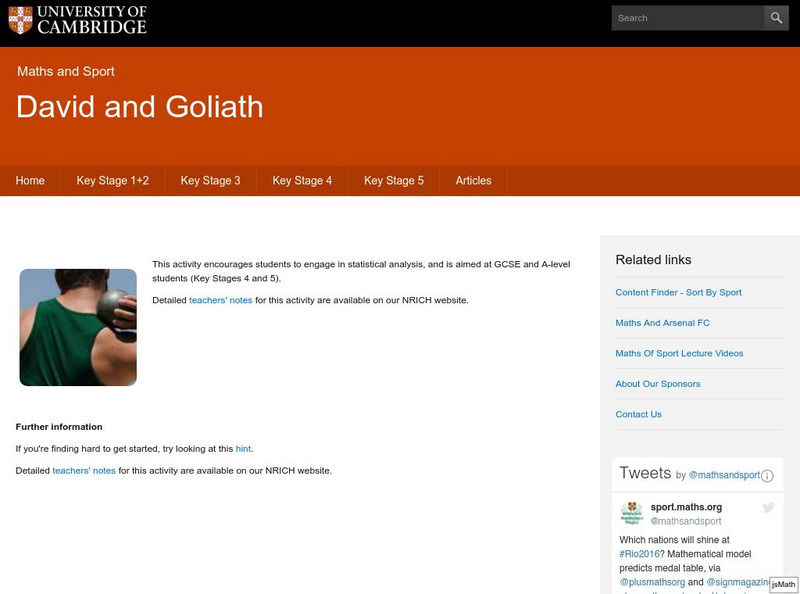
University of Cambridge: Maths and Sports: David and Goliath
Does weight give shot putters an advantage? This activity encourages students to engage in statistical analysis, and is aimed at GCSE and A-level students (Key Stages 4 and 5).


