Hi, what do you want to do?
Alabama Learning Exchange
Factoring by Mack
Learners explore the concept of factoring trinomials. For this factoring trinomials lesson, students use the Mack Method to factor trinomials. Learners watch a video on how to factor a trinomial with a coefficient of 1 with...
Oswego City School District
Regents Exam Prep Center: Problems Involving and & Or
This tutorial helps students understand the probability of two events occurring when the words AND & OR are used. There are examples and practice problems. The teacher resource pages include a demonstration and a computer simulation.
Sophia Learning
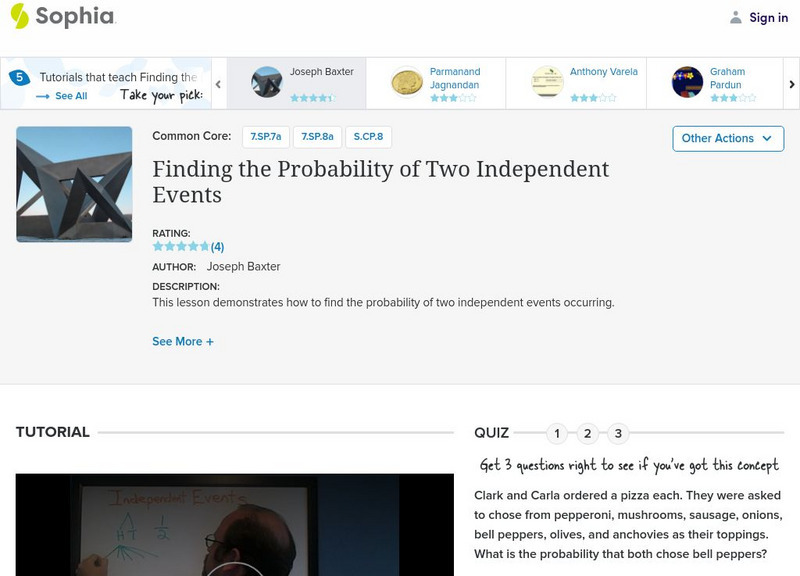
Sophia: Finding the Probability of Two Independent Events
Determine the probability of two independent events. Assess learning with a quiz.
Math Planet
Math Planet: Algebra 2: Probabilities
Discussion of probabilities through the use of examples and a video lesson. [0:35]
Oswego City School District
Regents Exam Prep Center: Theoretical Versus Empirical Probability
Use this site to learn the difference between theoretical and empirical probability. A practice page is included for each and two teacher resource pages contain classroom activities.
Thinkport Education
Thinkport: Algebra Ii: Conditional Probability
A module where students find and interpret probabilities; explore conditional probabilities, and use the conditional probability to determine if two events are independent; work with two-way tables as you analyze conditional...
Math Planet
Math Planet: Algebra 2: Permutations and Combinations
Discussion of permutations and combinations using examples and a video lesson. [1:15]
Other
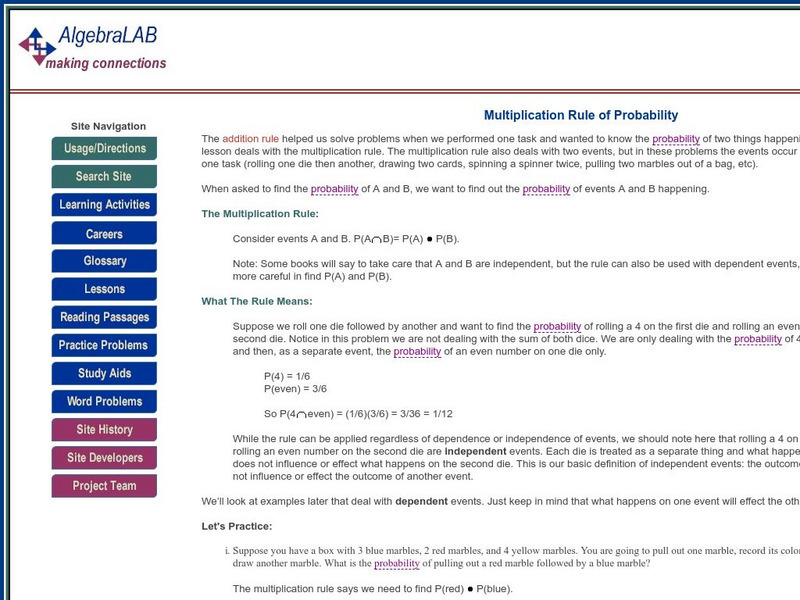
Algebra Lab: The Multiplication Rule of Probability
An explanation with examples of how to calculate probabilities of two dependent or independent events by multiplying their probabilities. Practice problems are provided along with their explanations.
Thinkport Education
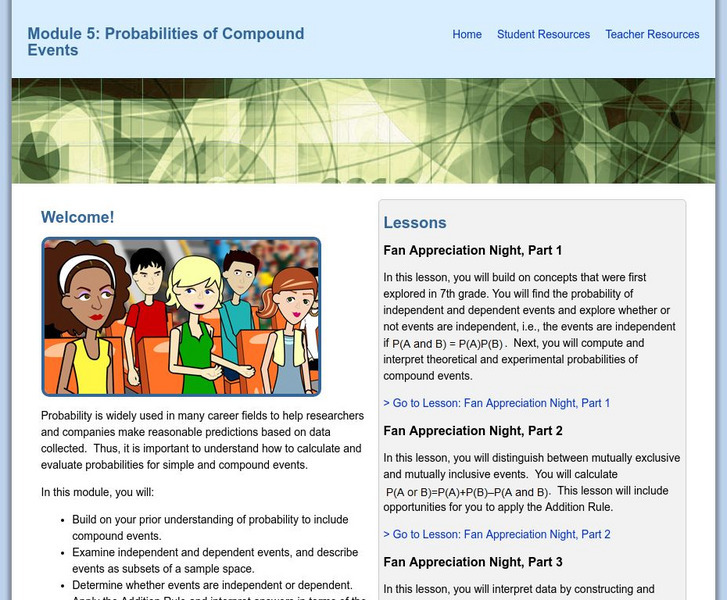
Thinkport: Algebra Ii: Probabilities of Compound Events
A module for students to build on prior understanding of probability to include compound events; examine independent and dependent events, and describe events as subsets of a sample space,; determine whether events are independent or...
Math Planet
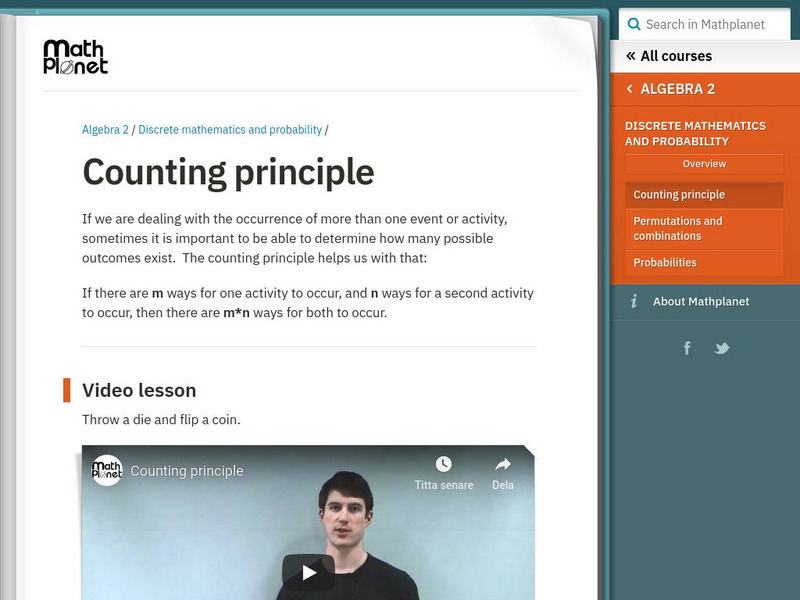
Math Planet: Algebra 2: Counting Principle
Video lesson helps to explain the counting principle. [0:42]
CK-12 Foundation
Ck 12: Algebra Ii: 5.2 Probability
In this section, students will explore different methods for determining the probability of complex events and conditional probabilities (such as unions, intersections, and complements).
Math Planet
Math Planet: The Mean, the Median, and the Mode
Gain an understanding of how to find the mean, median and mode by viewing examples and a video lesson. [2:22]
CK-12 Foundation
Ck 12: Algebra Ii: 5.1 Sample Spaces and Probability
This section explores how to determine the sample space, or possible outcomes, for an event such as rolling dice. It also investigates how to determine the probability of different outcomes occurring for an activity such as flipping a...
Oswego City School District
Regents Exam Prep Center: Mutually Exclusive Events
Use this site to learn what is means for two events to be mutually exclusive. Great examples show you how to calculate the probability of such events.
University of Cambridge
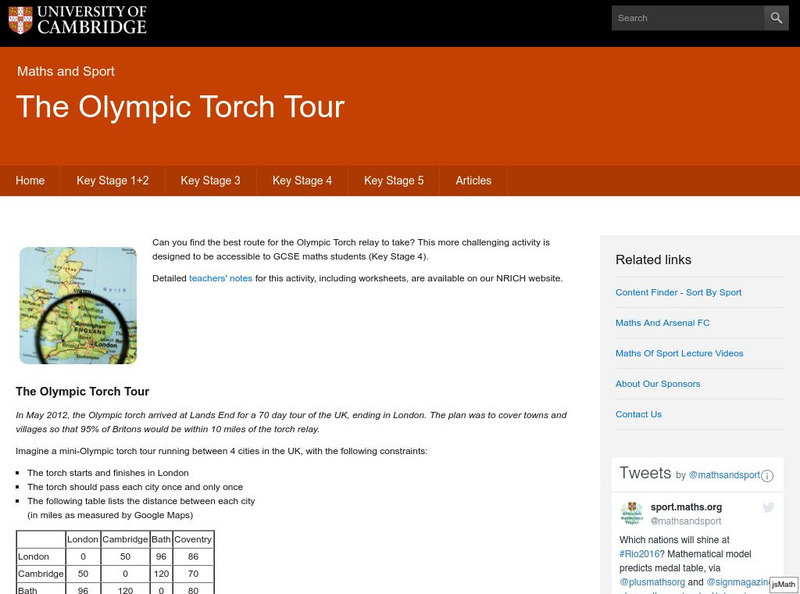
University of Cambridge: Maths and Sports: The Olympic Torch Tour
Can you find the best route for the Olympic Torch relay to take? This more challenging activity is designed to be accessible to GCSE maths students (grades 8, 9, and 10).
National Council of Teachers of Mathematics
Nctm: Standards for School Mathematics
This standards-based NCTM website offers resources for teachers of mathematics for all grade levels, including interactive math tools, lesson plans, online resources, and the like.
Alabama Learning Exchange
Alex: Statistically Thinking
The object of this project is for students to learn how to find univariate and bivariate statistics for sets of data. Also, the students will be able to determine if two sets of data are linearly correlated and to what degree. The...
Richland Community College
Richland Community College: Math 116 Lecture Notes
This site from the Richland Community College provides the detailed lecture notes to a college algebra course, complete with equations and definitions. Content ranges from "functions and their graphs" to "conics and parametric equations."
Annenberg Foundation
Annenberg Learner: Sampling the Electorate
As the pollster for candidate Higgins, you need to know how she is faring with different groups. Read her political profile, view the demographic profile of the city, decide on the groups to poll, review the results and learn about...


