College Board
2005 AP® Statistics Free-Response Questions Form B
Here's another great way to learn from the past. Released free-response questions provide a look into how concepts measured on the 2005 AP® Statistics Exam on Form B. Teachers and pupils review questions that cover concepts such as...
Math Guy
Algebra 1 Practice Final
What makes this resource special? The amazing answer key that comes with worked out solutions and notes for each problem. Practice problems include all topics ranging from linear systems to simplifying exponential expressions. The packet...
Texas Instruments
Exploring the Binomial Theorem
A comprehensive instructional activity that explores and researches Pascal's triangle and relates its properties to the Binomial Theorem through a variety of lessons. Have the class practice expanding polynomials using the theorem. A few...
Curated OER
Lucky Envelopes - Intro to Independence (has both reviews)
What are the chances you will pick a lucky envelope that contains money? Learners calculate conditional probabilities and are introduced to independent events. Use this worksheet for skills practice or get out actual envelopes and cash...
Curated OER
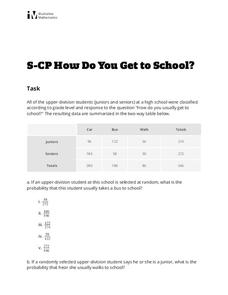
How Do You Get to School?
Looking for a short assessment on probability? Learners use a two-way table to calculate a probability and a conditional probability. Multiple choice answers could be eliminated to create a short-answer activity for your class. There are...
NY Learns
Investigation - What's in the Bag?
If you have or can create a set of tiles, numbered one through eight, then you can implement this hands-on lesson about probability models. Individuals draw a tile from a bag, record its number, and then return it to the bag. They...
Curated OER
Coffee at Mom's Diner
What is the probability that a random customer at Mom's Diner will put both cream and sugar in his coffee? Use the addition rule to find out! Use this worksheet to assess understanding, for skills practice, or during a lesson.
Curated OER
Lotto or Life: What Are the Chances?
Though the website does not seem to have the mentioned video, a reding and lottery style games simulate the chances of finding intelligent life somewhere other than Earth. Without the video, this lesson plan is short, but it can be a...
PBS
Remove One
With a set of 15 chips and a number line, learners predict what sums may occur with the rolling of two dice. When their sum comes up, they remove one of the chips from their number line with the objective of being the first to remove...
Education World
High, Low, or In Between?
Trios play a card game that reinforces the concepts of number sequence and greater than and less than. Scholars make predictions based on information they know and a single unknown. They see cards drawn by others in the group, but not...
Curated OER
A Statistical Study of the Letters of the Alphabet
Students gather appropriate information for simple statistical analysis. Then they will calculate probability working with a piece of literature that makes this lesson ideal for teaching across the whole curriculum.
Curated OER
China's Population Growth
Learners collect data from China's population growth and determine the mean, median, and mode from the data. In this data lesson plan, pupils determine probabilities and use them to make predictions.
Curated OER
Old Glory
Students utilize mathematical concepts such as: measurement, ratio and proportion and geometric probability to analyze the components of the U.S. Flag. They collect, organize and interpret data by constructing charts, tables and graphs...
Illustrative Mathematics
SAT Scores
If you earned a score of 610 on the math portion of the SAT, what would be your percentile ranking? Given the mean and standard deviation of normally distributed data, find the probability of getting a particular score, or that your...
Yummy Math
Soda Santa
Santa is the focal point of a worksheet that inquires how many cans and boxes of soda were used to create a supermarket display. As a small group project, the discussions that will ensue to evaluate the task's three questions will...
Curated OER
Geometric Probablitiy: Spinners and Dartboards
Sstudents explore and analyze the properties of geometric areas. In this geometry lesson, sstudents use technology to simulate spinners and dartboards in order to fing areas of circles and sectors of circles and compare and contrast...
Curated OER
Handling Data: Coin Tossing Simulation
Learners collect experimental data and record it on a frequency table. After accessing an Internet coin toss simulation site they discover that repetition of an experiment may result in different outcomes. They identify the mutually...
Curated OER
Expected Outcome
Young scholars determine expected values of experiments and explore distributions of experiments. They guess as to how many times a coin will flip heads in fifty tries. They flip a coin fifty times graphing the results on a histogram....
Curated OER
Box-and-Whisker
Seventh graders are introduced to the concept of box-and-whisker plots. A step-by-step process for creating a box-and-whisker plot is provided. The goal of the instructional activity is that students study the components of a...
Curated OER
Solving Genetic Puzzles
Seventh graders examine genetics combination using statistics. In this statistics lesson, 7th graders examine genetic trait using a table or punnett square to identify genotype and phenotype. This assignment requires more than one class...
Curated OER
Section 15-9: Permutations
In this permutations worksheet, students solve 16 multiple choice and short answer questions. Students find factorials and permutations of letters and numbers.
Curated OER
Tallest Stack Wins
Students build a stack of pennies as tall as possible, recording the number of pennies they are able to stack before the tower falls. Then, sharing answers, they determine the average number of pennies that could be stacked.
Curated OER
Mathematics Witing: Algebraic Processes and Its Connections to Geometry
Students, using manipulatives, determine how many different ways there are to arrange 3 and 4 objects. They organize and record their arrangements. Students investigate the pattern generated by 3 and 4 objects, they predict how many ways...
Curated OER
Great Tasting Shapes
Fifth graders investigate the concept of median, mode, and range using a simple model for display purposes. They examine different shaped crackers out of a box and identify the ones that occur the most. Then the calculations for the...
Other popular searches
- Experimental Probability
- Probability Games With Dice
- Probability Games
- Theoretical Probability
- Probability Sample Space
- Math Probability
- Compound Probability
- Probability and Statistics
- Genetics Probability
- Conditional Probability
- Probability Lesson Plans
- Simple Probability


