Curated OER
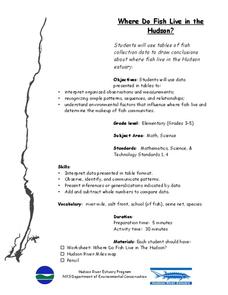
Where Do Fish Live in the Hudson?
Students explore the environmental factors that influence where fish live and determine the makeup of fish communities in the Hudson. They interpret guided observations and measurements to assess patterns, sequences and relationships.
Curated OER
Virtual Field Trip / Activity Research
Students visit a website to determine activities at three Michigan cities. They calculate the total cost of participating in the activities or visiting places such as zoos, planetariums, historic sites, and museums.
Curated OER
Opening the Case
Students participate in a class survey and then design an experiment and use graphs and statistics to assist them in solving a problem. They organize the results of the survey in a stem-and-leaf plot and find the range, median, mean, and...
Curated OER
The Stock Exchange Phase I
Second graders select a stock and follow its ups and downs, using graphs to show its success.
Curated OER
The Amazing Race
Seventh graders engage in a discussion to determine their experience with traveling. Ask them to describe differences in transportation, currency, culture, food, accommodation, etc. Then they discuss the different expenses one has when...
Curated OER
Weather Chart
Students select at least 6 cities from around the world to keep track of their high and low temperatures over a period of time.
Curated OER
Weather Variables Lab
Students examine what happens when air temperature drops and gets closer to the dewpoint. They perform a lab activity which illustrates the effects on humidity, precipitation and barometric air pressure.
Curated OER
Record 'The' Results
Third graders predict how many times they'll see the word "the" in a newspaper page and highlight all the "the"s they find. After reviewing definitions of range, median, mode, mean they create a Stem and Leaf Plot and a Back-to-Back Stem...
Curated OER
Calendar Creations About the Civil War
Eighth graders research key events in the Civil War and create a calendar with illustrations and key events listed throughout the year.
Curated OER
Weather for Health
Ninth graders encounter various types of numerical information (represented in multiple ways), much of which is abstract and difficult to comprehend. In this lesson, 9th graders will convert given information into bar graphs. In the...
Curated OER
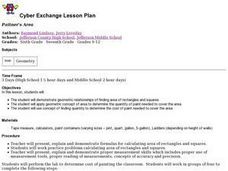
Painter's Area
Students demonstrate geometric relationships of finding area of rectangles and squares. They apply determine the quantity of paint needed to cover the area by using the concept of quantity.
Curated OER
Women in the Labor Force
Students examine the differences men and women experience in the work force. They study the relationship between education and the likelihood of employment.
Curated OER
Frequency vs. Size
Students identify and interpret sound as a vibration and what period and frequency are. They also divide the various types of objects so that all objects are explored and the procedures are determined by the students.
Finally, students...
Curated OER
Using an Amortization Table
Students search the Internet to find a site that contains an amortization table and make a hypothesis about the results of changing time and rate. They examine the affects of time and rate on a mortgage and discuss the difference in the...
Curated OER
Hypothesis Testing: Top Ten Singles
Students review and better examine hypothesis testing and evaluation of probability distributions. the use of the discovery method is vital to the studying because it is about student interests which helps for motivation.
Curated OER
Bar Me In
Fourth graders watch a video about constructing bar graphs. They create their own graph and interpret it.
Curated OER
American Political Thought: Minority Influence
Sixth graders brainstorm the reasons why people would want to leave their homeland to live in the United States. In groups, they research the political representation of the Board in New Haven, Connecticut. They also write a paper on...
Curated OER
Pay Check Advance Loans
Students explore the implications of obtaining loans. They assess interest rates, amount to be paid back, and the implications if they do not pay back the loan on time. Students develop a comparison chart.
Curated OER
Out of Sight, Out of Mind
Students analyze and graph the waste created in a typical lunch period. They increase awareness of various types of garbage students create during a lunch period. They construct and label a graph of lunch waste. They brainstorm...
Curated OER
How Fragile Is an Egg?
Students design a "container" for his/her egg to determine whether the egg remain intact when dropped from a predetermined height.
Curated OER
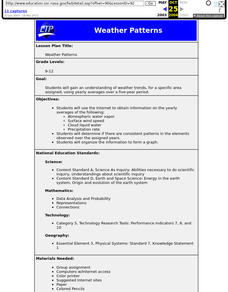
Weather Patterns
Students use yearly averages over a five-year period to understand weather trends for a specific area.
Curated OER
Calendar and Opening
Students review the days of the week and tell what the current day is by singing a song. They fill in the sentence telling the day of the week it is and then discuss what day yesterday was and the name of the day tomorrow and then talk...
Curated OER
Cinderbank
Fourth graders identify major components of a "Cinderella" story in order to create a database.
Curated OER
Manatee Awareness Survey
Students examine the public's awareness of manatees by taking a survey. They display the results of the survey as a graph.


