Texas Education Agency
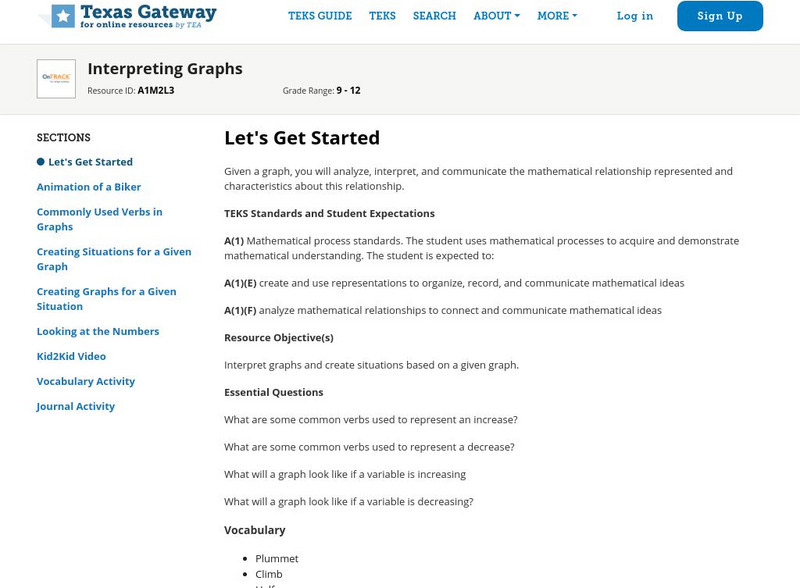
Texas Gateway: Interpreting Graphs
Given a graph, the student will analyze, interpret, and communicate the mathematical relationship represented and its characteristics.
TeachEngineering
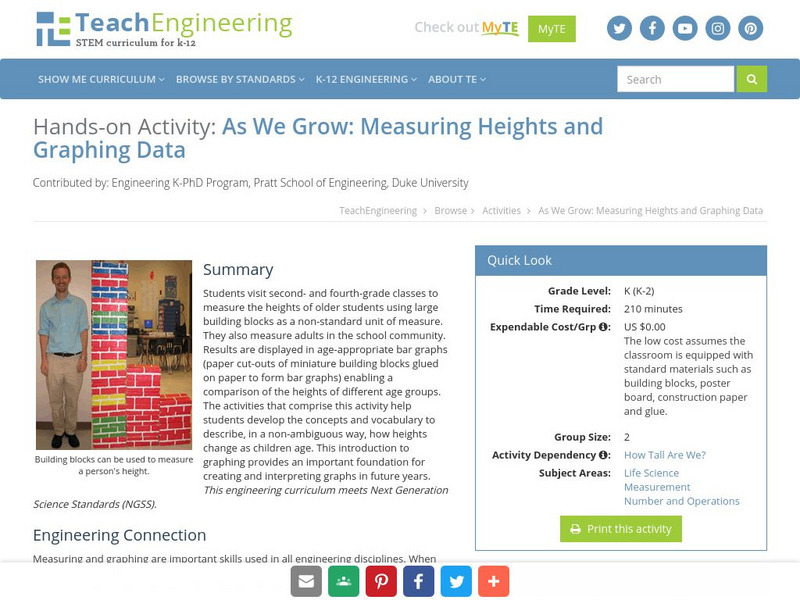
Teach Engineering: Growing and Graphing
Students visit a 2nd and a 4th grade class to measure the heights of older students using large building blocks as a non-standard unit of measure. They can also measure adults in the school community. Results are displayed in...
McGraw Hill
Glencoe: Self Check Quizzes 1 Using Graphs to Make Predictions
Use Glencoe's randomly generated self-checking quiz to test your ability to use graphs to make predictions. Each question has a "Hint" link to help. Choose the correct answer for each problem. At the bottom of the page click the "Check...
US Department of Education
National Center for Education Statistics: Create a Graph Tutorial
This tutorial walks students through how to create different types of graphs using the Create a Graph tool available on the website. Covers bar graphs, line graphs, pie charts, area graphs, scatter plots, and dependent and independent...
ReadWriteThink
Read Write Think: Bio Graph Graphing Life Events
Contains plans for four 50-minute interdisciplinary lessons that ask students to interview people and graph significant life events in order to write about those events. In addition to student objectives and standards, these...
Texas Education Agency
Texas Gateway: Analyzing the Effects of Changes in "A" on the Graph Y=ax^2 + C
Given verbal, graphical, or symbolic descriptions of the graph of y = ax^2 + c, the student will investigate, describe, and predict the effects on the graph when "a" is changed.
Interactive Mathematics
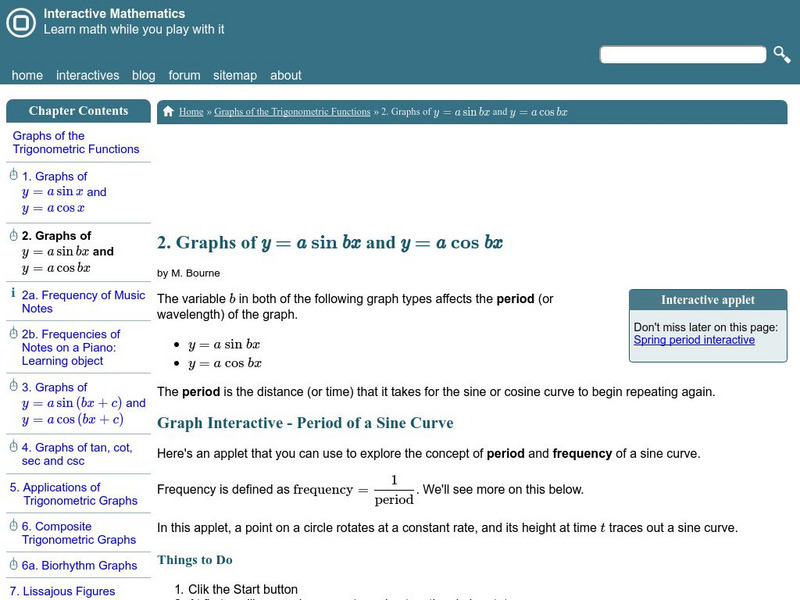
Interactive Mathematics: Graphs of the Trigonometric Functions
The tutorial investigates period and frequency by examining the shapes of the sine and cosine functions. The resource consists of definitions, animations, interactive graphs, and examples. Practice problems with solutions are included.
Texas Education Agency
Texas Gateway: Graphing Data to Demonstrate Relationships
Given problem situations, the student will graph data with a constant rate of change to demonstrate relationships in familiar concepts, such as scaling.
PBS
Pbs Learning Media: What's Up With the Weather: Graphs
Examine this graph from FRONTLINE/NOVA: "What's Up with the Weather?" Web site to see dramatic increases in three greenhouse gases over the last two hundred years.
PBS
Pbs Learning Media: Global Warming: Graphs Tell the Story
Examine these graphs from the NOVA/ FRONTLINE Web site to see dramatic increases in the temperature of Earth's surface and greenhouse gases in the atmosphere.
Interactive Mathematics
Interactive Mathematics: Graphs of Sine and Cosine Functions
An interactive graph provides a demonstration to show how the measure of an angle is related to the sine and cosine waves. Topics covered include amplitude and period. Examples allow students to practice the concepts.
Mathigon
Mathigon: Graphs and Networks: Graphs in Everyday Life
This lesson focuses on graphs in everyday life including virtual graphs such as the Internet or physical computer networks of computers. It puts graph theory into practice and provides examples and learning exercises.
Mathigon
Mathigon: Graphs and Networks: Parties and Dating
This lesson uses handshakes at a party to explain complete graphs, when every vertex is connected to every other vertex. It shows how a formula was created to calculate the number of edges.
National Council of Teachers of Mathematics
The Math Forum: Graphing Linear Functions
Use this guide to practice graphing linear functions using Claris Works with your students. The lesson walks you through the process of setting up Claris Works step-by-step.
CK-12 Foundation
Ck 12: Algebra: Graphs of Rational Functions Study Guide
This comprehensive study guide highlights the main terms and formulas needed to understand graphs of rational functions. Examples are included.
Math Planet
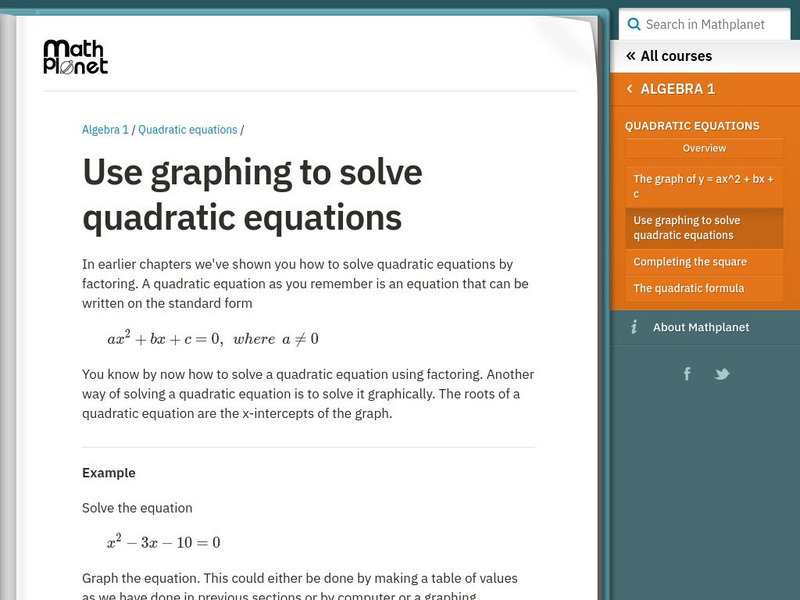
Math Planet: Use Graphing to Solve Quadratic Equations
A quadratic equation is an equation that can be written on the standard form ax^2 + bx + c = 0, where a is not = 0. One way of solving a quadratic equation is by factoring. Another way of solving a quadratic equation is to solve it...
California State University
Ca State University, San Bernadino: Graphing Techniques
A survey of math graphing techniques includes horizontal and vertical shifts, stretching, lines of symmetry, even and odd functions, and absolute value functions.
Purple Math
Purplemath: Graphing General Polynomials, Radicals, Rationals, and Piecewise Fun
This resource provides an overview of graphing, giving examples of general polynomial, radical, rational, and piecewise functions. Also includes advice on common mistakes made by students.
Illustrative Mathematics
Illustrative Mathematics: F if.c.7.a, a sse.b.3, F if.c.7: Graphs of Quadratic
During this task, students will realize that equivalent expressions produce the same graph. The lesson plan will lead to discussions about the value of different forms of equations. Aligns with F-IF.C.7.a, A-SSE.B.3, and F-IF.C.7.
University of Guelph
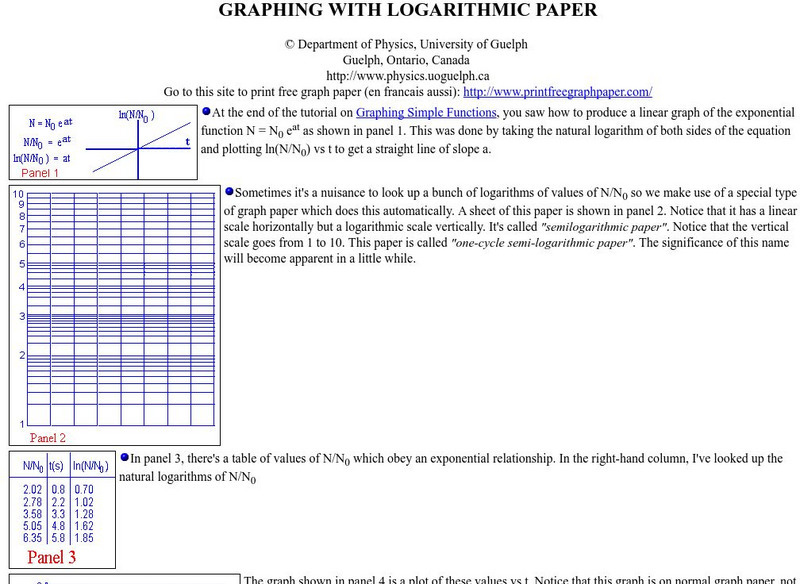
University of Guelph: Graphing With Logarithmic Paper
Good tutorial explaining how to produce a graph on logarithmic paper.
Richland Community College
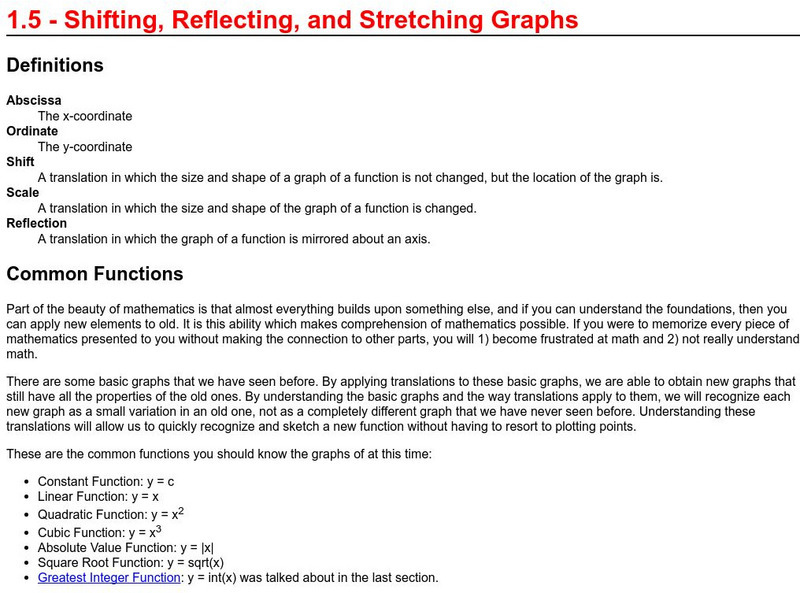
Richland Community College: Shifting, Reflecting, Stretching Graphs
This site provides everything you need to know about translating graphs. Plenty of examples and charts and very easy to understand.
Paul Dawkins
Paul's Online Notes: Algebra: Graphing Polynomials
Detailed math tutorial features notes and examples that take a look at the process of graphing polynomials.
CK-12 Foundation
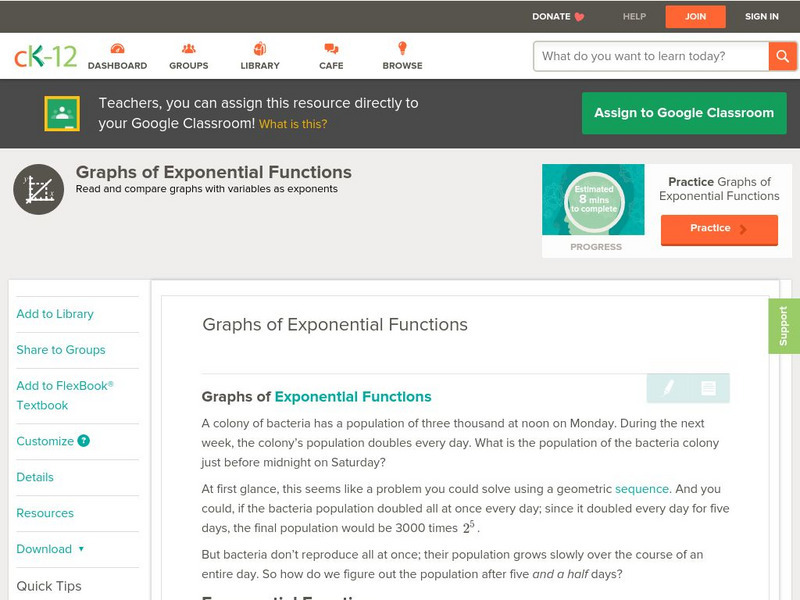
Ck 12: Algebra: Graphs of Exponential Functions
[Free Registration/Login may be required to access all resource tools.] Students graph an exponential function and compare graphs of exponential functions on the same coordinate plane. Students examine guided notes, review guided...
Other
Math Works: Directed and Undirected Graphs
A graph is a collection of nodes and edges that represents relationships. You can use graphs to model a wide variety of systems. View examples of directed and undirected graphs and how they are constructed in this resource.
Other popular searches
- Coordinate Graphing Pictures
- Charts and Graphs
- Graphic
- Graphic Organizers
- Graphing Ordered Pairs
- Bar Graphs
- Circle Graph
- Vertex Edge Graph
- Graphing Skills Lesson Plans
- Graphic Design
- Line Graphs
- Double Bar Graph
