Curated OER
Starting With Stats
Statisticians analyze a data set of student IQs by finding measures of central tendency and dispersion such as mean, median, mode, and quartiles. They practice using a graphing calculator to find the values and analyze box plots and...
Curated OER
Integrated Algebra Practice: Frequency Histograms, Bar Graphs and Tables
In this graphs worksheet, students solve 4 problems about histograms, bar graphs, and tables. Students answer questions about histograms, bar graphs, and tables.
Curated OER
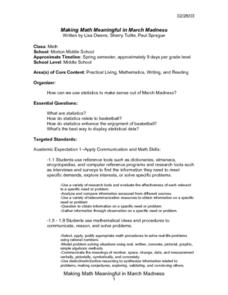
Making Math Meaningful in March Madness
Middle schoolers examine the statistics of March Madness, the college basketball tournament. They watch videotaped basketball games to collect data for further analysis using Word and Excel. They analyze the data in a variety of...
Curated OER
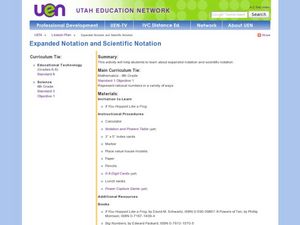
Represent Rational Numbers
Students identify expanded notation and scientific notation. In this rational numbers lesson, students use a calculator to discover the powers of 10. Students practice writing numbers in expanded notation using powers of 10. Students...
Curated OER
Studies of the Eastern Worlds: Population Graphing
Seventh graders participate in several learning/research stations in which they view artwork from various countries of the Eastern world and collect information on the populations of the Eastern countries. They then use this information...
Curated OER
City, County, Community
Students explore issues and situations that make for a city and its local environments. In this local government lesson, students design maps, define issues and create brochures that illustrate their understandings of these concepts and...
Curated OER
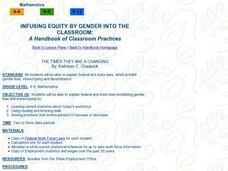
Infusing Equity Vs Gender into the Classroom
Students explore the effect of gender bias in the classroom. In this statistics lesson plan, students discuss the effects of stereotyping, discrimination, and gender bias in the classroom. They collect data on different work places...
Curated OER
Gender Equity in the Classroom
Students review employment statistics and wages over the past 20 years. They examine the Federal Work Force Laws. They apply formulas to find the rate of change in the minimum wage.


