Curated OER
The Greedy Triangle - Group Activity
Students explore different shapes and identify them. They make a community map using triangles, rectangles, circles, ovals, squares, pentagons, and hexagons.
Curated OER
Equivalent Fractions
Students read, "TheDoorbell Rang" by Pat Hutchins and relate this story to a time when they had to share something equally between friends or family members. They then complete a worksheet in which they represent sharing situations using...
Curated OER
Money & Work
Twelfth graders explain basic information concerning financial investments. They identify consumer rights and responsibilities and effective practices for purchasing consumer goods, services, housing and insurance. They list steps in...
Curated OER
Coin Tossing and Graphing
Fifth graders use technology as assistance to collecting random data. Through the random data they will be able to explain the significance of getting a head or tail depending on what was previously landed on. They will then analyze the...
Curated OER
Candy is Dandy
Learners investigate color distribution in bags of M&Ms They sort and classify the contents of a bag of M&Ms and summarize their findings on a worksheet. Students convert the numbers into charts and make predictions about color...
Curated OER
Bias in Statistics
Students work to develop surveys and collect data. They display the data using circle graphs, histograms, box and whisker plots, and scatter plots. Students use multimedia tools to develop a visual presentation to display their data.
Curated OER
Counting Zero to Five
Students are introduced to the numerals zero through five. They associate the numeral with the correct number of objects. Students comprehend the quantities zero through five showing "How many?" by counting their fingers or using a...
Curated OER
SOS: Save Our Ski Slopes
Students defend downhill skiing as an Olympic Games event by creating a presentation that graphically proves the economic impact and popularity of this event.
Curated OER
Using Excel to Draw a Best Fit Line
Students create line graphs for given data in Microsoft Excel. Students follow step by step instructions on how to create their graph, including how to create a trend line. Students print graphs without trend lines and manually draw...
Curated OER
Guess the Age
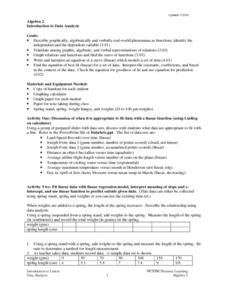
Students describe graphically, algebraically and verbally real-world phenomena as functions; identify the independent and the dependent variable. They translate among graphic, algebraic, and verbal representations of relations and graph...
Curated OER
Slavery and the Underground Railroad
Students examine a map of the Underground Railroad. They trace the slaves journeys and calculate the mileage. They write an essay about the risks and penalties one faced in escaping. They work together in groups to name characteristics...
Curated OER
Planning a Garden
Seventh graders research the World Wide Web to research and plan a garden for their school. They draw a scale model of the garden, determine the cost, and create a presentation to promote their garden plan.
Curated OER
Timeline - Curriculum Connections
Students research a timetable for the building of the Tacoma Narrows Bridge. After the research is completed, students construct a graph and come up with different proposals for the building of the bridge.
Curated OER
Theoretically Speaking
Students define probability. They determine outcome from a given situation based on simple probability. Students create experimental data using a coin and a number cube. They write how theoretical and experimental probability are different.
Curated OER
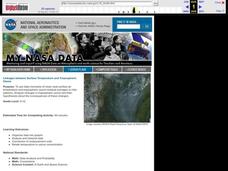
Linkages Between Surface Temperature And Tropospheric Ozone
High schoolers organize and analyze data regarding changes in tropospheric ozone and then hypothesize about the consequences of these changes.
Curated OER
Baby Project - Cost Analysis - First Year of Life
Students determine the costs associated with teenage pregnancy and childbirth through the child's first year. They consider prenatal and postnatal care for mother and child, clothing, food, equipment, childcare, etc. They present their...
Curated OER
Mathematics: Budgeting
Students develop a month long budget. They use problem solving skills to adjust their budgets for unforeseen expenses. They use checks to pay mock bills.
Curated OER
Introduction To Data Analysis
Seventh graders investigate the concept of looking at the data put in a variety of ways that could include graphs or data sets. They analyze data critically in order to formulate some sound conclusions based on real data. Students graph...
Other popular searches
- Free Powerpoint Math Lessons
- Powerpoint Math Lessons 8.2d
- Powerpoint Lessons for Math
- Math Powerpoint Lessons
- Powerpoint Math Lessons 82d


