Curated OER
1930 Census and the Consitution
Students read the Constitution and discuss the importance of enumeration. In this Census lesson, students complete a Census schedule and discuss the job skills of applicants. Students research Census data to compare and contrast the...
Curated OER
Birthday Problem
Young scholars identify the probability of an event occurring. Learners explore the complement of an event in finding why an event will not happen. They also explore basics of probability within algebra.
Curated OER
Chapter 5 Review
In this statistics instructional activity, students solve and complete 10 different types of problems. First, they determine the probability of various actions described. Then, students describe an appropriate model for the number...
Curated OER
Analyzing Country Data
Students analyze different data in percentage form. In this statistics lesson, students plot data using box-plots, dotplot, and histogram. They compare and contrast the collected data using the boxplot.
Curated OER
What is a P-value?
Students test the hypotheses using p values. In this statistics lesson, students define and examine conditional probability. They test each statement for a true statement or a false statement, based on the sample size.
Curated OER
Samples and Stats
Students explore different methods of taking surveys and conducting polls and examine these methods for bias. They design and administer a sample survey, analyze the data and present their findings to the class.
Curated OER
District Decisions
Students review census data and examine the manner in which reapportionment and redistricting occurs. They, in groups, debate a proposed change in the way congressional districts are drawn and present their debates to the class.
Curated OER
Places and Production
Young scholars calculate United States GDP and GDP per capita, use a choropleth map to acquire information, and create choropleth maps of GDP per capita in South America. They identify regions with high and low GDP per capita
Curated OER
Places and Production
Students investigate the economy and the market value of goods. In this algebra instructional activity, students differentiate between domestic goods value and international good value. The define and identify the importance of GDP or...
Curated OER
Meaning of Alpha
students define the alpha level. In this statistics lesson, students identify what makes the "null rejected" and discuss the data surrounding the null. They observe the meaning of alpha as it relates to the bell curve.
Curated OER
CATCH, TAG and RELEASE
Students apply estimation strategies for problem-solving purposes. They become familiar with one aspect of a marine biologist's work.
Curated OER
Logarithms #4
For this Algebra II/Pre-Calculus worksheet, students solve problems that involve the applications of logs and exponentials. The eight page worksheet contains seventeen problems. Answers are not provided.
Curated OER
Caddo Circle Book
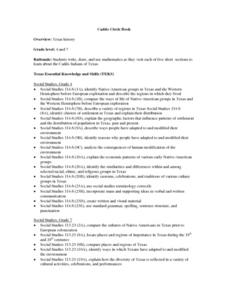
Pupils are introduced to the Caddo Indians of Texas. Using a compass, they draw a circle given specific dimensions and cut them out. Using the text, they read one section abut the Indians and complete the task listed on one of their...
Curated OER
Survey Project
Eighth graders create a website using FrontPage. They use inserted forms to collect survey information and use Microsoft Excel and MS Word to create a presentation of the survey and the results.
Curated OER
More of U.S.
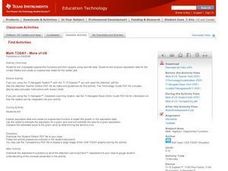
Explore graphical representation of a real-life data set and determine the exponential regression model for the data in your classroom. Students also compare the estimated value to the given value by determining the percent error.
Curated OER
Business & Statistics: Final Exam
In this business and statistics worksheet, students read real-life business problems, arrange data, and identify the probability method best used to determine the answer. They identify the type of random sample, draw stem-and-leaf plots,...
Curated OER
Composite Functions
Students create a poster to explain composite functions. In this composite function worksheet, students explore linear equations and functions. They complete a worksheet and use manipulatives to complete problems.
Curated OER
Campaign 2000
Students research newspapers and the Internet to learn about the election. Students work in groups and choose a state that they want to compare to Florida. Students organize the data they have found into a graph labeling an "x" and "y"...
Curated OER
Building Straw Towers
Students apply their knowledge of technology to help them build. In this science and technology lesson, students build straw towers and investigate the strength and form of the structure. They analyze the best design the make the...
Curated OER
Dating Practices
Students interpolate, extrapolate, and make predictions from given information. They present results and conclusions from given data using basic statistics. Pupils create a survey from a critical question and decide which sampling...
Curated OER
High Exposure
Students interpret data they receive from the media, discuss possible misinterpretation of data from the media and correctly respond to the misconception quiz question.
Curated OER
See the World
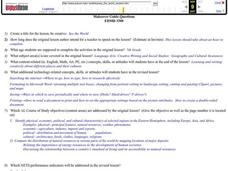
Seventh graders locate and write creatively about different places and their cultures. They identify the physical, economic, social, political and cultural characteristics of selected regions in the Eastern Hemisphere. Finally, 7th...
Curated OER
Track Your Trip
Fourth graders are shown how to read a map and identify key cities, landmarks, rivers, state boundaries, and train routes. They solve basic mathematical problems. Students reivew the componets of a map legend. They are asked to find...
Curated OER
American Civilization - The Ice Age
First graders discuss the Ice Age land bridge over the Bering Straits and how it affected the population of the Americas. They construct a clay model of the land bridge and research common animals of the time.


