Columbia University
Nasa: Sedac: Population Distribution and Change
[Free Registration/Login Required] A collection of forty-nine data sets from SEDAC (Socioeconomic Data and Applications Center) that examine the distribution of human populations around the world and the changes that have taken place in...
Other
America's Civil War: Population Distribution of the Future Confederate States
Provides information on the 1860 Population distribution of the the eleven future Confederate states after the Civil War.
US Census Bureau
Population Pyramids
Visual representations of population distribution by age and sex for any country.
US Census Bureau
U.s. Census Bureau: Population Change and Distribution [Pdf]
This U.S. Census Web site gives current and past information on population changes and distribution. Must have an Adobe Reader to access.
CK-12 Foundation
Ck 12: Episd: Population Size, Density, and Distribution
[Free Registration/Login may be required to access all resource tools.] Students will identify and understand the significance of size, density and distribution in the population of organisms.
US Census Bureau
Us Census Bureau: Population Pyramid Graph for Canada
Graphs showing the population pyramids of Canada from the year 2018. Shows a comparison of males versus females.
Missouri State University
Missouri State University: Introductory Statistics: The Sampling Distribution
A review is provided at the start of this resource, then the more specific discussion of sampling distributions gets under way. Graphs are provided for ease in understanding the material.
Science Education Resource Center at Carleton College
Serc: Simple Population Space Usage
Using data on population, land area, and house size, students will investigate how much space is used by people in Texas compared to the population of the world, and how much space would be required to give everyone in the world the...
Other
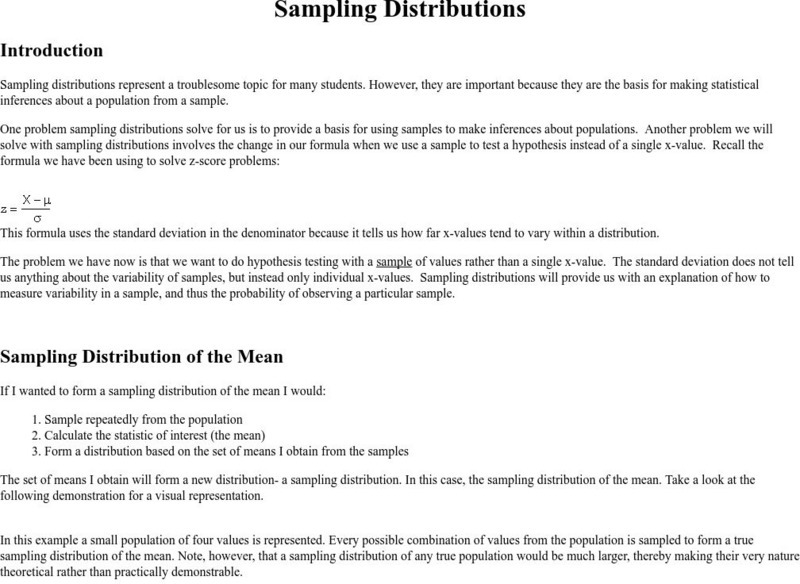
Fayetteville State Univ.: Sampling Distributions
A detailed explanation of statistical sampling distributions is provided here. Several graphs are attached to aid in understanding. The sampling distribution of the mean and the Central Limit Theorem are also discussed at this site.
Other
Texas Population Growth, Projections, and Implications [Pdf]
A report analyzing the population changes that have occurred in Texas since the middle of the 20th century, and the expected projections for the future. It breaks the numbers down by race and ethnicity to show that Hispanics will...
Science Education Resource Center at Carleton College
Serc: Using an Applet to Demonstrate a Sampling Distribution
In this activity students are exposed to the concept of sampling distributions by creating an example as a class. By having the students assemble the data, they can more readily understand that a sampling distribution is made up of a...
Texas Instruments
Texas Instruments: The Normal Distribution
In this activity, students will apply the normal density function, normal cumulative distribution function, and inverse normal cumulative function to analyze a population with a normal distribution.
Columbia University
Nasa: Sedac: Urbanization and Human Settlements
[Free Registration/Login Required] A collection of twenty data sets from SEDAC (Socioeconomic Data and Applications Center) that examine urbanization in major metropolitan areas of the United States in the late 20th and the early 21st...
Other
Virtual Museum of Labrador: People
Discover the varied and diversified people that make up the population of Labrador. The four separate cultures include the Inuit, the Innu, the Metis, and the Settlers. Learn all about them.
Curated OER
Etc: Maps Etc: Population Distributions in Africa, 1920
A map from 1920 of Africa and Madagascar showing the population distribution in the region, keyed to show densities ranging from under 2 persons per square mile to over 250 persons per square mile.
Curated OER
Etc: Maps Etc: Population Distributions in Asia , 1920
A map from 1920 showing the population distributions in Asia.
US Census Bureau
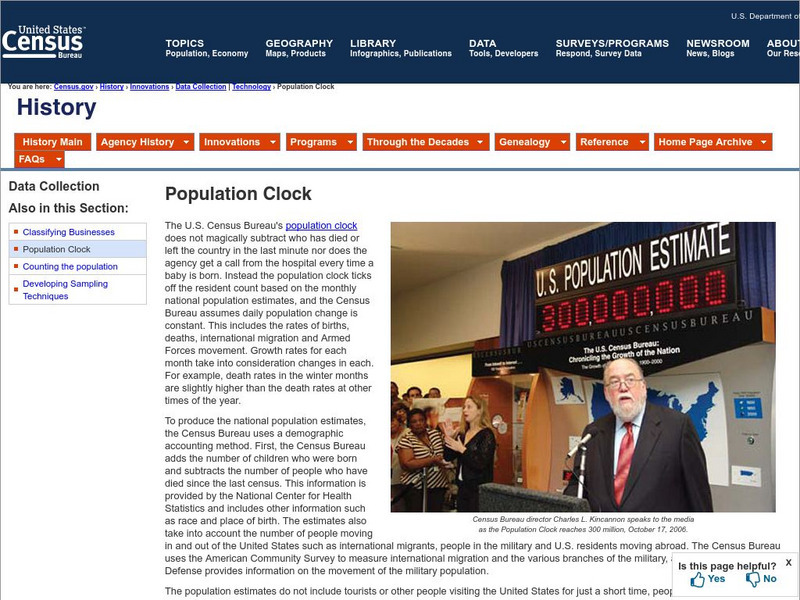
U.s. Census Bureau: Population Clocks
This U.S. Census Bureau Web site has two population clocks with notes available. One clock shows the population increase for the United States. The other shows the world population increase.
Khan Academy
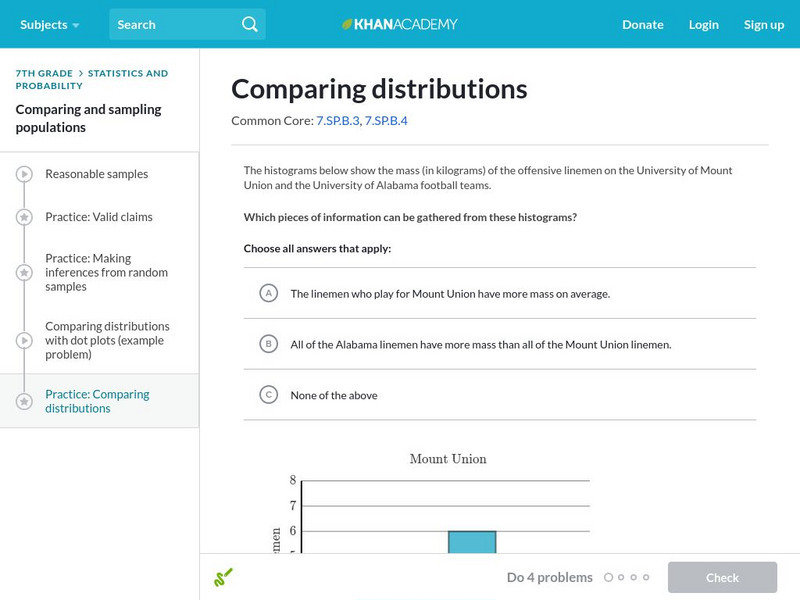
Khan Academy: Comparing Distributions
Try these practice problems comparing distributions.
Khan Academy
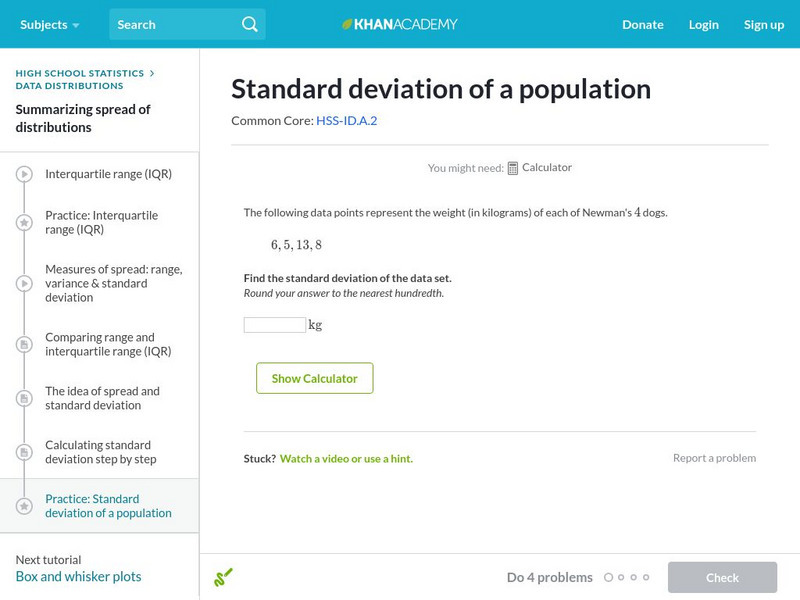
Khan Academy: Standard Deviation of a Population
Calculate the standard deviation of a population. Students receive immediate feedback and have the opportunity to try questions repeatedly, watch a video or receive hints.
CK-12 Foundation
Ck 12: Statistics: F Distribution
[Free Registration/Login may be required to access all resource tools.] In this Concept, students will be introduced to the F-distribution in order to test hypotheses about multiple independent population variances.
Curated OER
Etc: Maps Etc: Population Distribution of China, 1971
A map from 1971 showing comparative population distribution patterns of China and the United States. The map illustrates the terrain barriers to population development in China, and the trend to dense populations along the coast and...
Curated OER
Etc: Maps Etc: Population Distribution of North America, 1916
A map from 1916 of North America, Central America, Greenland, and the Caribbean to Puerto Rico showing the population distribution at the time. The map is color-coded to show areas where the population density ranges from under 1...
Curated OER
Etc: Maps Etc: Population Distribution of Asia, 1921
A base map of Asia from 1921 showing the general population distribution of the region at the time. "The climate of southeastern Asia is so warm and moist that food plants grow there in abundance. Nearly half the people of the world live...
Curated OER
Etc: Maps Etc: Population Distribution of North America, 1921
A base map from 1921 of North America, Central America, and the Caribbean showing the general population distribution in Alaska, Greenland, Dominion of Canada, United States, Mexico, and Central America at the time. People are most...
