Curated OER
Galluping Away
Pupils use Gallop Poll results to explore causes and effects of the concerns of Americans in the past. They administer a similar poll and consider what Americans in their community view as the most pressing problems in the United States...
Curated OER
Quick Stats with Quick Poll
Learners analyze data using bar graphs and the TI in this statistics lesson. They investigate quick polls and graph the data using different properties of statistics. This assignment requires a TI Navigator.
Curated OER
Magnetic Polls
Students explore the New Hampshire primaries and the polling process by analyzing polling information, examining the effects of polls, and creating graphs that represent polling data.
Curated OER
Every Vote Counts Lesson Plan
Students conduct weekly opinion polls or surveys about topics that are important to classmates. Using the information gathered, they design a bulletin board display. On the display, they show the poll questions, the names of the groups...
Curated OER
Poll Positions
Students analyze and graph the results of a nationwide New York Times poll about race in the United States. They poll people in their community regarding their views and experiences, and compare and contrast local and national poll data.
Curated OER
Election Poll, Variation 2
When a random sample isn't enough, your math class can compare the data from a physical simulation to decide if the probability is still likely. The lesson is part of a probability series that focuses on one question and different ways...
Curated OER
Election Poll, Variation 3
Build on probability and incorporate a random number generator to select outcomes for a school election. Your learners will record their results on a dot plot and answer questions regarding whether their candidate has a chance at the...
Curated OER
Opinions, Please!
Young scholars discuss the meaning and purposes of polls and surveys. After reading an article, they analyze the results of a poll given to residents of New York City. They create a survey of their own and analyze the data to write a...
Curated OER
Graphing Statistics & Opinions About Pets
Students explore how to use a double bar graph by polling other students about their feelings and experiences with pets. They also have the opportunity to think about how pets affect their lives. Students poll their classmates to find...
Illustrative Mathematics
Mr. Brigg's Class Likes Math
A quick discussion question that brings some collaboration into your classroom will allow your thinkers to make a decision about sampling. Mr. Briggs wants to know if the results from his class are a valuable comparison to the entire...
Curated OER
Measured Opinions
Young scholars read "Public Is Wary but Supportive on Rights Curbs," at the New York Times online. They explore how opinion polls are created and conducted, focusing on the wording of questions and the methods of sampling a population.
EngageNY
Conditional Relative Frequencies and Association
It is all relative, or is it all conditional? Using an exploration method, the class determines whether there is an association between gender and superpower wish through the use of calculating conditional relative frequencies. The...
CCSS Math Activities
Smarter Balanced Sample Items: 6th Grade Math – Target A
Only in math problems do people buy 18 cans of tennis balls and no one wonders why. Scholars solve for the number of total tennis balls given the ratio of balls per can. This and other ratio word problems in a PowerPoint from Grade 6...
Curated OER
Pictographs
What do these pictographs show? Scholars analyze three sets of data organized into pictographs, filling in several comprehension questions about each. The first one is done for them as an example, but consider going over it together to...
Curated OER
Bar Graphs
What are these bar graphs depicting? Novice data analyzers examine two basic bar graphs and answer three comprehension questions about each. The first graph shows tickets sold per date and the next is distances run per member of a cross...
Curated OER
Bar Graphs and Pictographs
How are bar graphs and pictographs different? As you begin this concept, use these simple graphs to help get learners started with data analysis styles. There is one bar graph and one pictograph, each accompanied by four or five...
Curated OER
Voter Turnout
Explore politics by analyzing the voting process. Pupils discuss the purpose of casting votes in an election, then examine graphs based on the data from a previously held election's turnout. The lesson concludes as they answer study...
Curated OER
Using Bar Graphs
What's your favorite pizza topping? Scholars analyze two bar graphs, one depicting a math club's favorite pizza toppings and the other ice cream sales per flavor. As they examine the graphs, learners answer a few comprehension questions....
Curated OER
Play Ball: A Major League Review Game
In this review and test-taking practice lesson plan, the classroom is set up like a baseball field. The class is set up into 2 teams and has to answer questions that moves them along the bases like in baseball. The team that wins has the...
Curated OER
Bias Sampling
Students explore statistics by conducting a scientific study. For this data analysis lesson, students conduct a class poll about popular foods of their classmates. Students complete a worksheet and discuss how bias opinions affect the...
Curated OER
Tables
Can you read this table? Learners begin to comprehend data analysis through examining two simple tables and answering comprehension questions. The first gives characteristics about three animals in yes-or-no format (i.e. "eats insects,"...
Curated OER
Too Free, Or Not Too Free?
Students create a survey that examines what level of electronic surveillance might be acceptable to members of the school and community. They poll the community, and analyze the results in the form of graphs and a written news article.
Curated OER
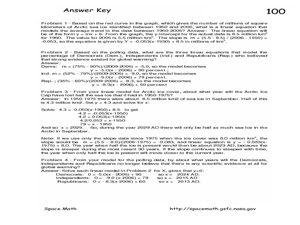
The Global Warming Debate and the Arctic Ice Cap
In this global warming and the Arctic ice cap worksheet, students use two graphs showing data about the amount of Arctic sea ice between 1950 and 2006 and the percent of people surveyed that believe the Earth has gotten warmer over the...
Curated OER
How Do You Like Your Eggs?
First graders conduct a poll about how people like their eggs. In this graphing lesson, 1st graders collect data about how they like their eggs. Students use a picture of themselves to place under the type of egg they like. Students then...


