Curated OER
Introduction to Functions
Students explore functions, function rules, and data tables. They explore terms of linear functions. Students use computers to analyze the functions. Students write short sentences to explain data tables and simple algebraic expressions.
Curated OER
Circles
In this circles instructional activity, 10th graders solve and complete 20 different problems related to various circles. First, they find the radius and diameter of a circle with a given circumference. Then, students determine the...
Curated OER
Pictures, Graphs and Diagrams
In this algebra worksheet, students define vocabulary related to circles, and other conics. They graph hyperbolas and eclipse. There are 20 questions.
Curated OER
Relating Distance and Velocity Over Time
Students calculate the distance and velocity over time. In this algebra activity, students graph a linear function to represent the distance vers time travel. They interpret their graphs and draw conclusion.
Curated OER
Reading Graphs
Learners practice plotting functions on the Cartesian coordinate plane, see several categories of functions, including lines and parabolas, and read a graph, answering questions about the situation described by the graph
Curated OER
Graphing Data from the Chemistry Laboratory
Young scholars graph and analyze data using a spreadsheet.
Curated OER
Reading Graphs
Students plot functions on the Cartesian coordinate plane. They explore lines and parabolas. Students analyze graphs and answer questions about the information presented on the graph using an online program.
Curated OER
Introduction to Linear Functions
Young scholars are introduced to the concept of linear functions. Using new terminology, they describe linear functions in sentences and in data tables. Using the internet, they calculate and record answers to problems which are...
Curated OER
Linear Progression
Students use graphing calculators to graph lines and create tables of values. They perform an experiment using M&M's and slinkys, then create their tables based on their results.
CK-12 Foundation
Ck 12: Algebra: Linear Equations in Point Slope Form
[Free Registration/Login may be required to access all resource tools.] Learn how to use the point-slope form of linear equations and functions.
CK-12 Foundation
Ck 12: Algebra: Linear Equations in Point Slope Form
[Free Registration/Login may be required to access all resource tools.] Learn how to use the point-slope form of linear equations and functions.
CK-12 Foundation
Ck 12: Algebra: Linear Equations in Point Slope Form
[Free Registration/Login may be required to access all resource tools.] Learn how to use the point-slope form of linear equations and functions.
Math Planet
Math Planet: Writing Linear Equations Using Point Slope Form and Standard Form
Provides examples and a video lesson that illustrates how to write linear equations using point-slope form and standard form.
Khan Academy
Khan Academy: Algebra I: Point Slope Form
Write equations in point-slope form given two pairs of values, and convert the equation into slope-intercept form. Students receive immediate feedback and have the opportunity to try questions repeatedly, watch a video or receive hints.
Purple Math
Purplemath: Straight Line Equations: Point Slope Form
Two very clear examples of point-slope form are given in this Purplemath lesson. One example begins with the slope and a point and the other example begins with two points. Includes interactive widget for practice determining a linear...
Khan Academy
Khan Academy: Point Slope Form
Write equations in point-slope form given two pairs of values, and convert the equation into slope-intercept form.
Other
Central Michigan University: Point Slope Form
This resource features information on the point-slope form in geometry. It provides a good definition, several examples, and information on various forms.
Free Math Help
Free Math Help: Point Slope Form
The tutorial examines point-slope form. Learners investigate the method for graphing a linear equation on an x-y axis. Detailed examples and a message board to post additional questions are included.
Northeast Parallel Architectures Center, Syracuse University
Npac Reu Program: Point Slope Form
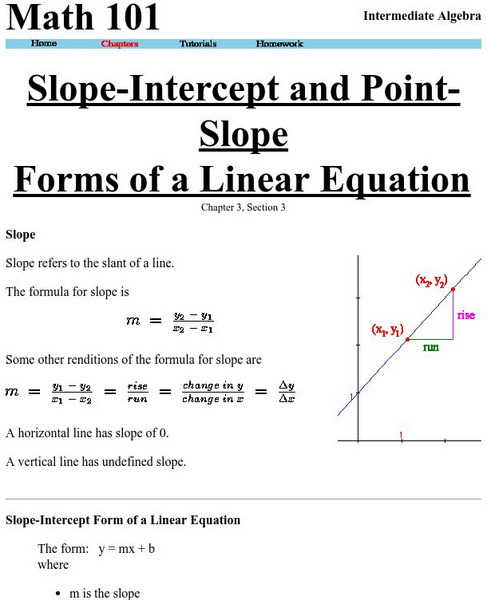
This Northeast Parallel Architectures Center of Syracuse University site contains a brief description of the point-slope form for equations along with the formula.
Oswego City School District
Regents Exam Prep Center: Slopes and Equations of Lines
Explanation of linear equations and four types of slopes: positive, negative, zero, and undefined. Practice problems for the students are provided and a reinforcement activity using a graphing calculator is offered for the teacher's use.
Washington State University
Washington State University: Slope Intercept, Point Slope Forms
Washington State University provides a lesson on finding the slope of an equation and putting the equation into the desired form. The site also contains informatinon concerning parallel and perpendicular lines.
Sophia Learning
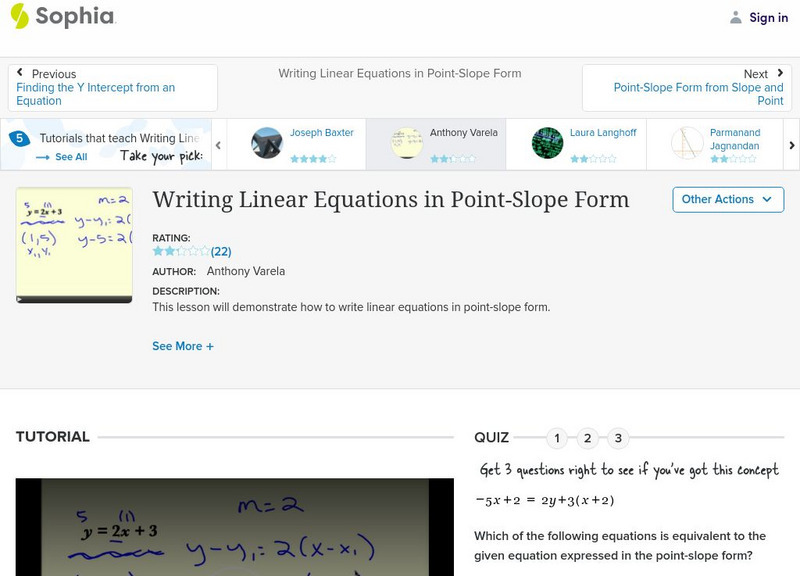
Sophia: Writing Linear Equations in Point Slope Form: Lesson 2
This lesson will demonstrate how to write linear equations in point-slope form. It is 2 of 5 in the series titled "Writing Linear Equations in Point-Slope Form."
Varsity Tutors
Varsity Tutors: Hotmath: Practice Problems: Writing Equations of Lines
Twenty-three problems present a variety of practice writing equations of lines. They are given with each step to the solution cleverly revealed one at a time. You can work each step of the problem then click the "View Solution" button to...


